FinTech
FP&A platform for finance teams
A B2B platform for budgeting, forecasting and reporting. I came in as its first designer, ran three rounds of research to find where finance teams lose time, and turned the findings into a design system, rebuilt navigation and a self-serve report builder.
- Client's country
- Canada
- Platform
- Web · B2B
- Team
- 33 people · first designer on the product
- Duration
- 10 months · 2022–2023
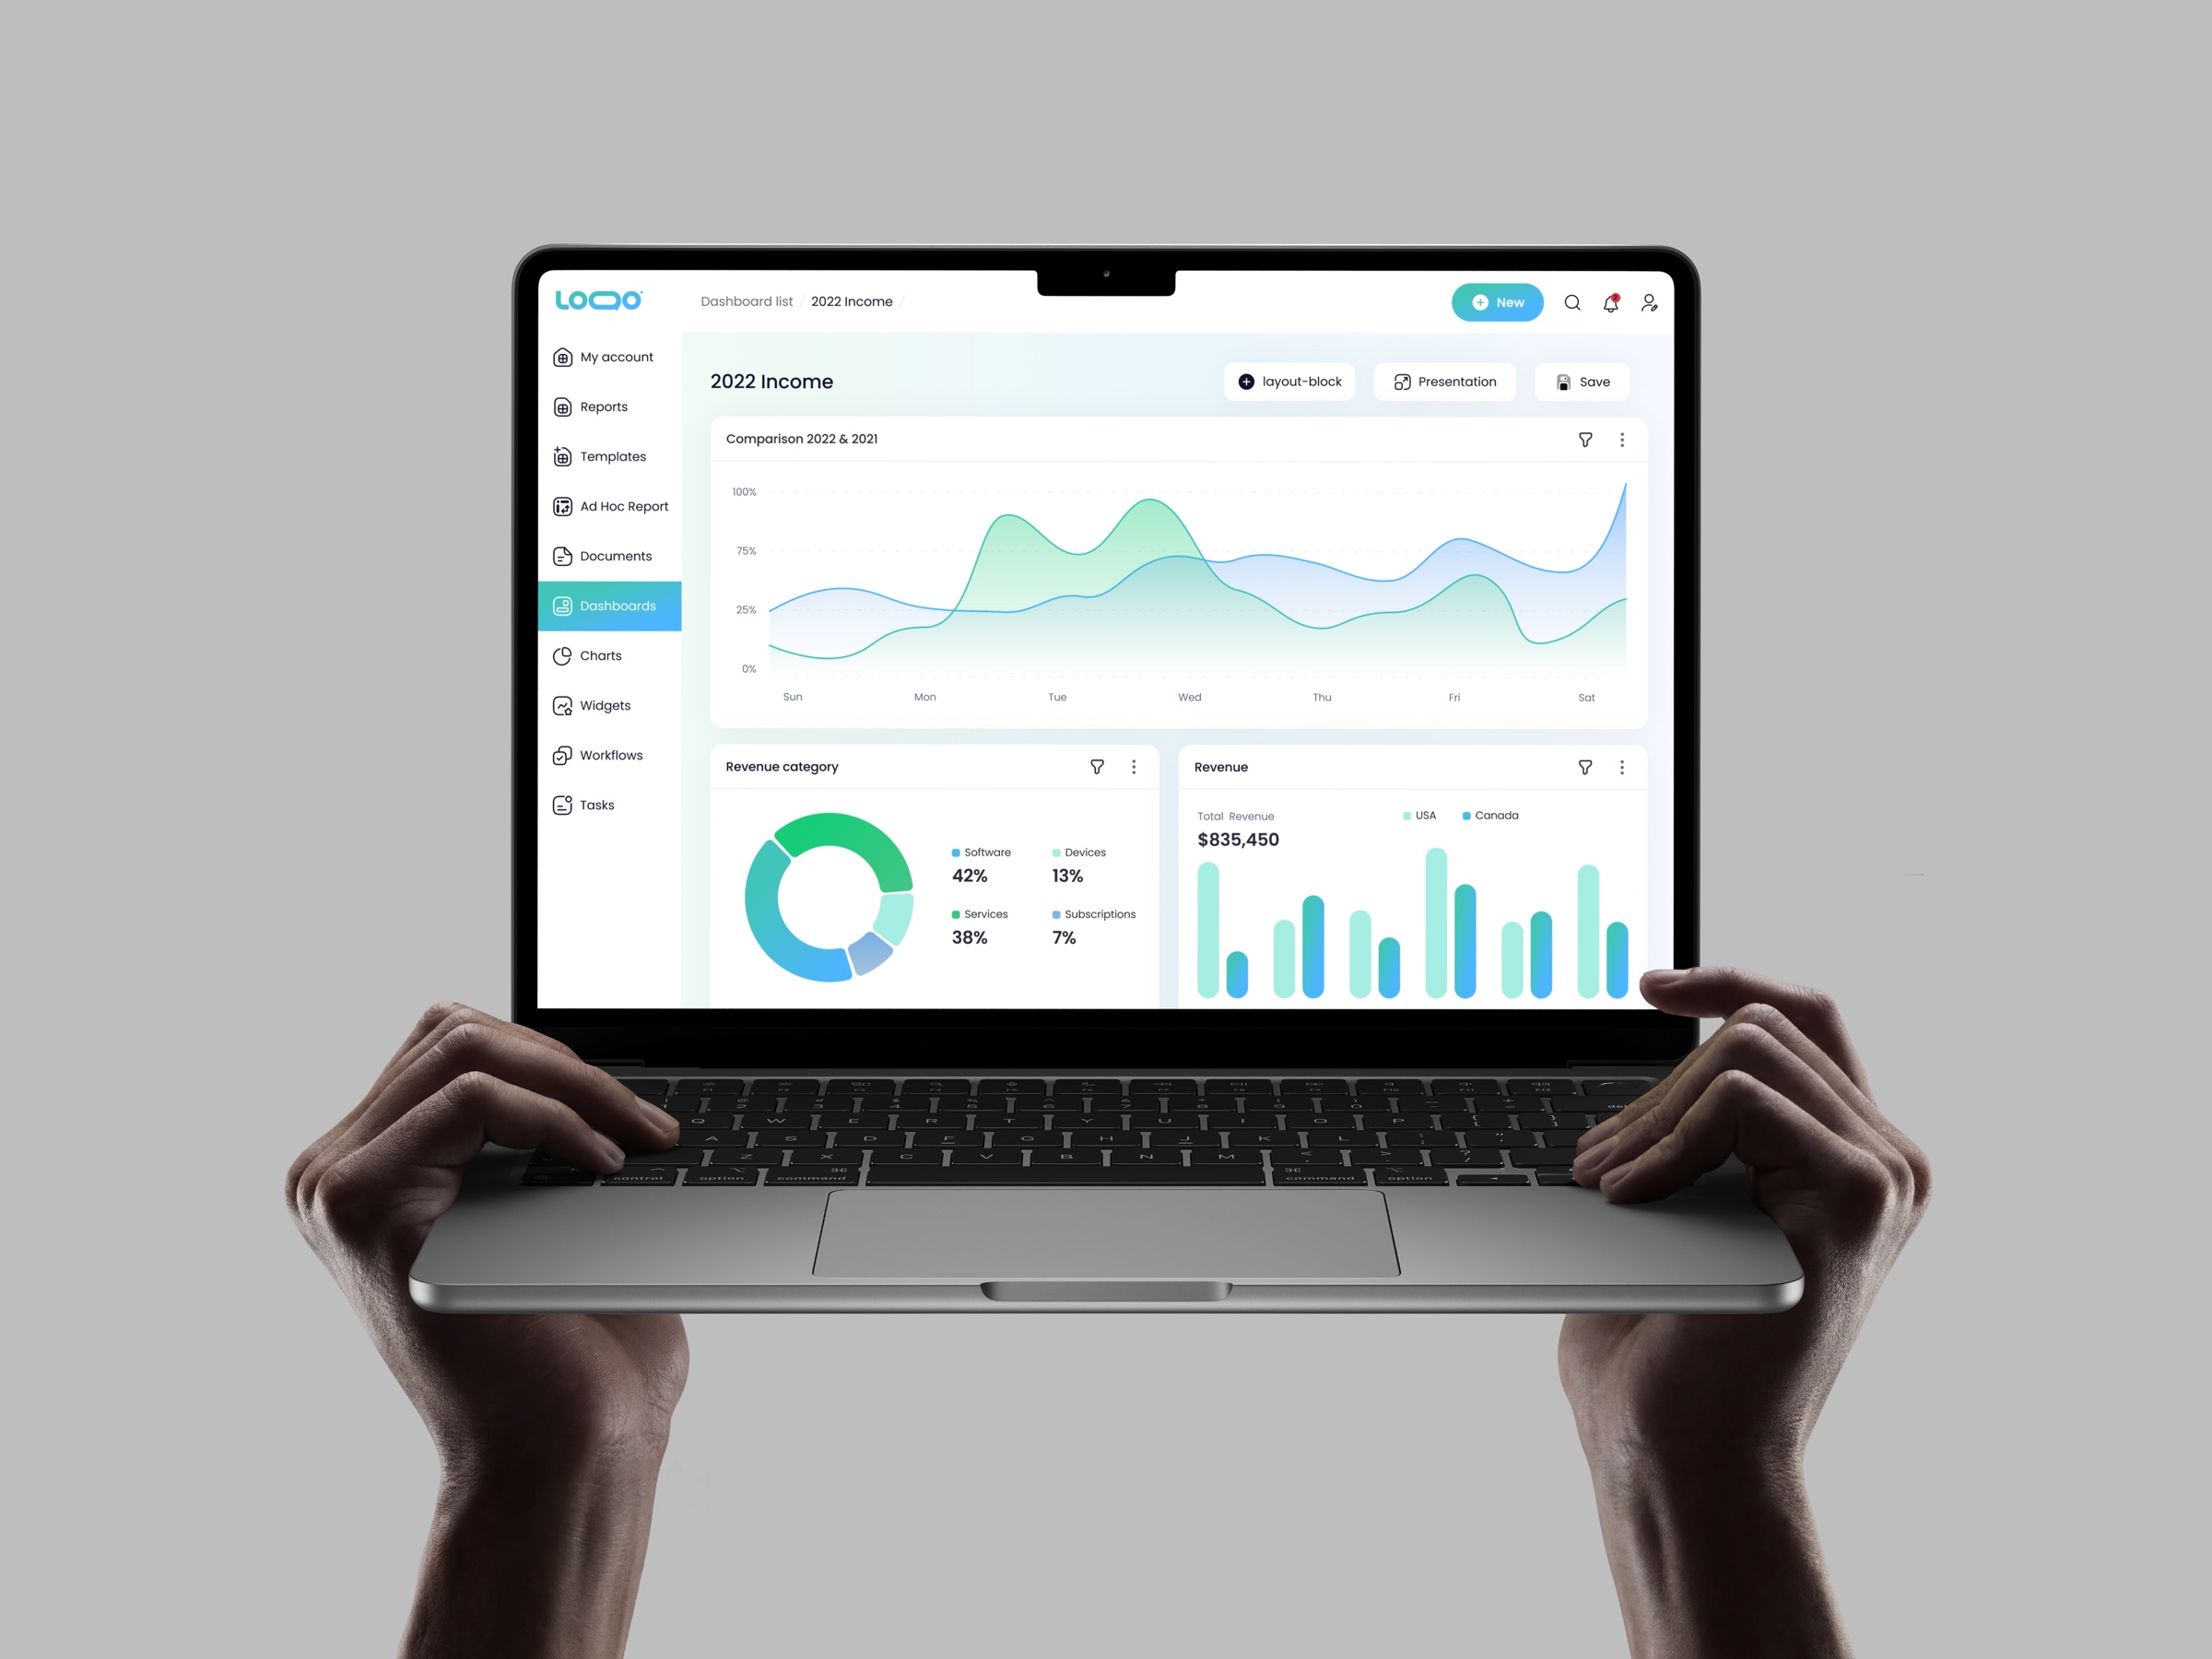
Overview
A B2B platform for financial management: budgeting, forecasting, reporting and cross-department collaboration.
Starting point
No designer before me. I was brought in to find the key problems and build a structured plan to fix them.
What I did
Three research stages set the agenda; a design system, rebuilt navigation and Excel-native tables followed.
Result
Ad Hoc Reports let users build their own report templates, which cuts custom development.
Context
01
Product
Budgeting, forecasting and reporting tools with cross-department collaboration, role-based access down to individual cells, and configurable security.
02
Users
Finance teams, accountants and department heads. Departments edit only their assigned cells; managers see everything. Excel is their native language.
Approach
Analyze
Product analysis with an effort-impact matrix for quick wins.
Go inside
Interviews across departments and onboarding-call observation.
Validate
Surveys and moderated testing: prototype against the current version.
Three research stages turned a wall of visible issues into a prioritized, feasible plan.
Process
Core functionality
01
Tables
Problem
Financial software is complex by nature: inputs, formulas, permissions. The interface had to get out of the way without oversimplifying the tools finance people rely on, because the same tables are used daily by power users and by someone opening the product for the first time.
Hypothesis
If tables open the product and behave the way the tool finance people already use behaves, the product's complexity stops being the barrier.
Solution
The product lives on data: tables as the initial view, with filtering and sorting shaped around how finance users actually scan numbers.
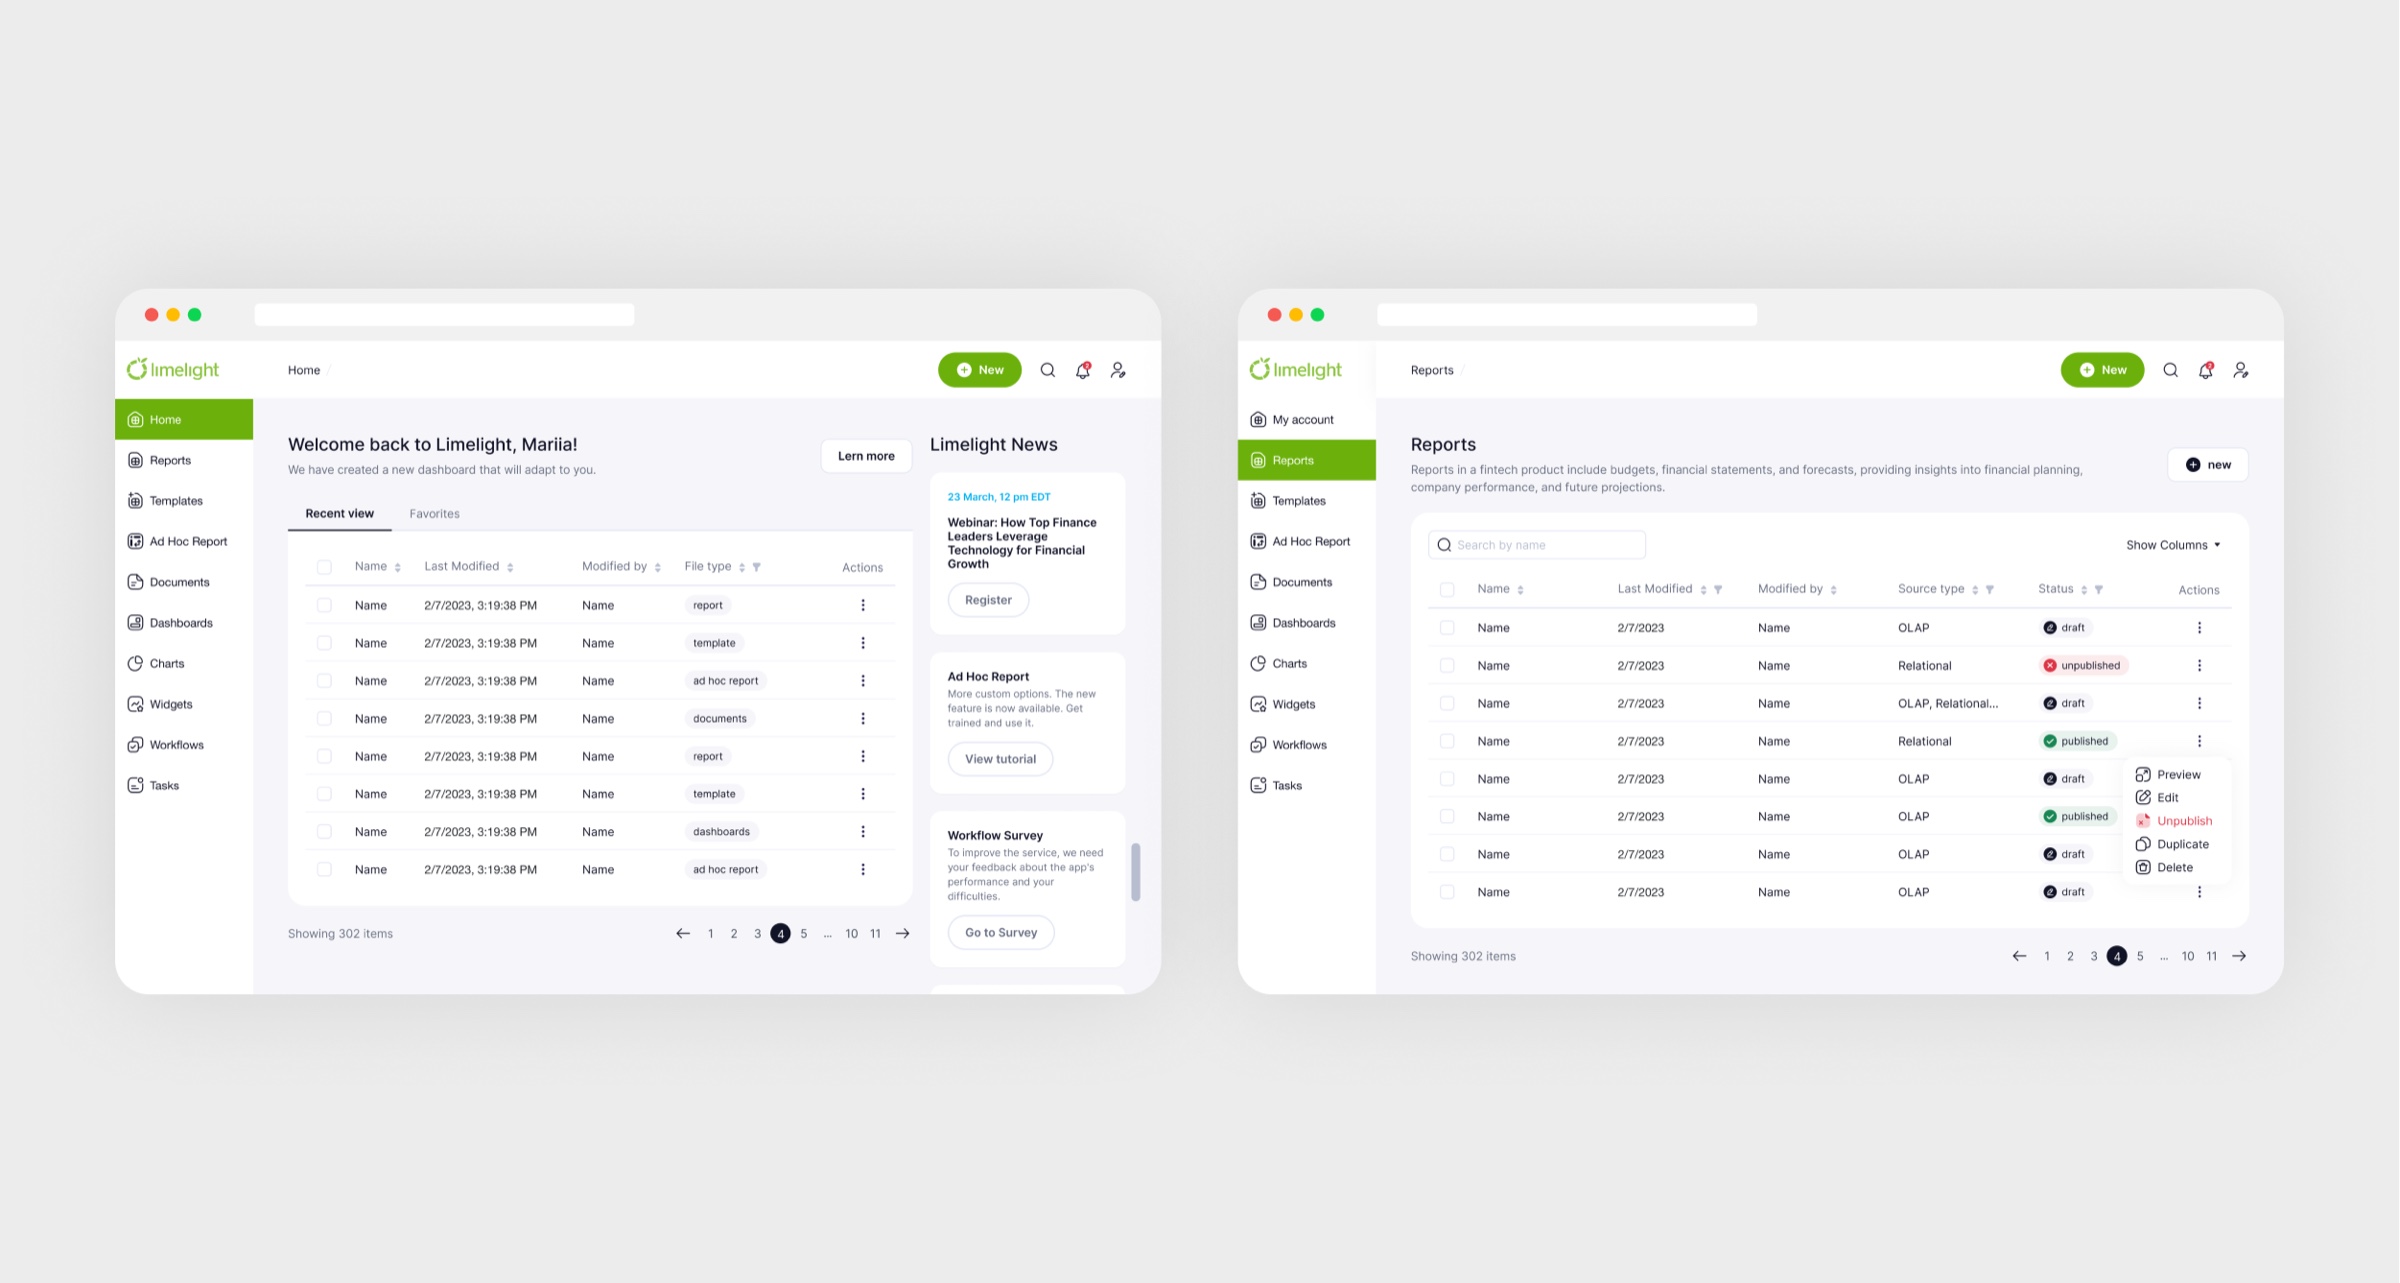

Finance people start from numbers, not charts, so tables open the product.
Result
Workflows refined with the finance teams themselves, so both groups could work without a translator.
02
Analytical dashboards
Problem
People used dashboards in completely different ways: as a start page, for KPIs, for presentations. A sizeable group avoided them altogether because there was no clear place to begin.
Hypothesis
If there is a modular grid and ready examples, a dashboard stops starting from a blank sheet, and all three groups of users build one.
Solution
Widgets users add and customize: charts with filtering and scaling, tables, images, text, all linked to source files and updating automatically. A modular grid and example templates give every team a clear starting point.
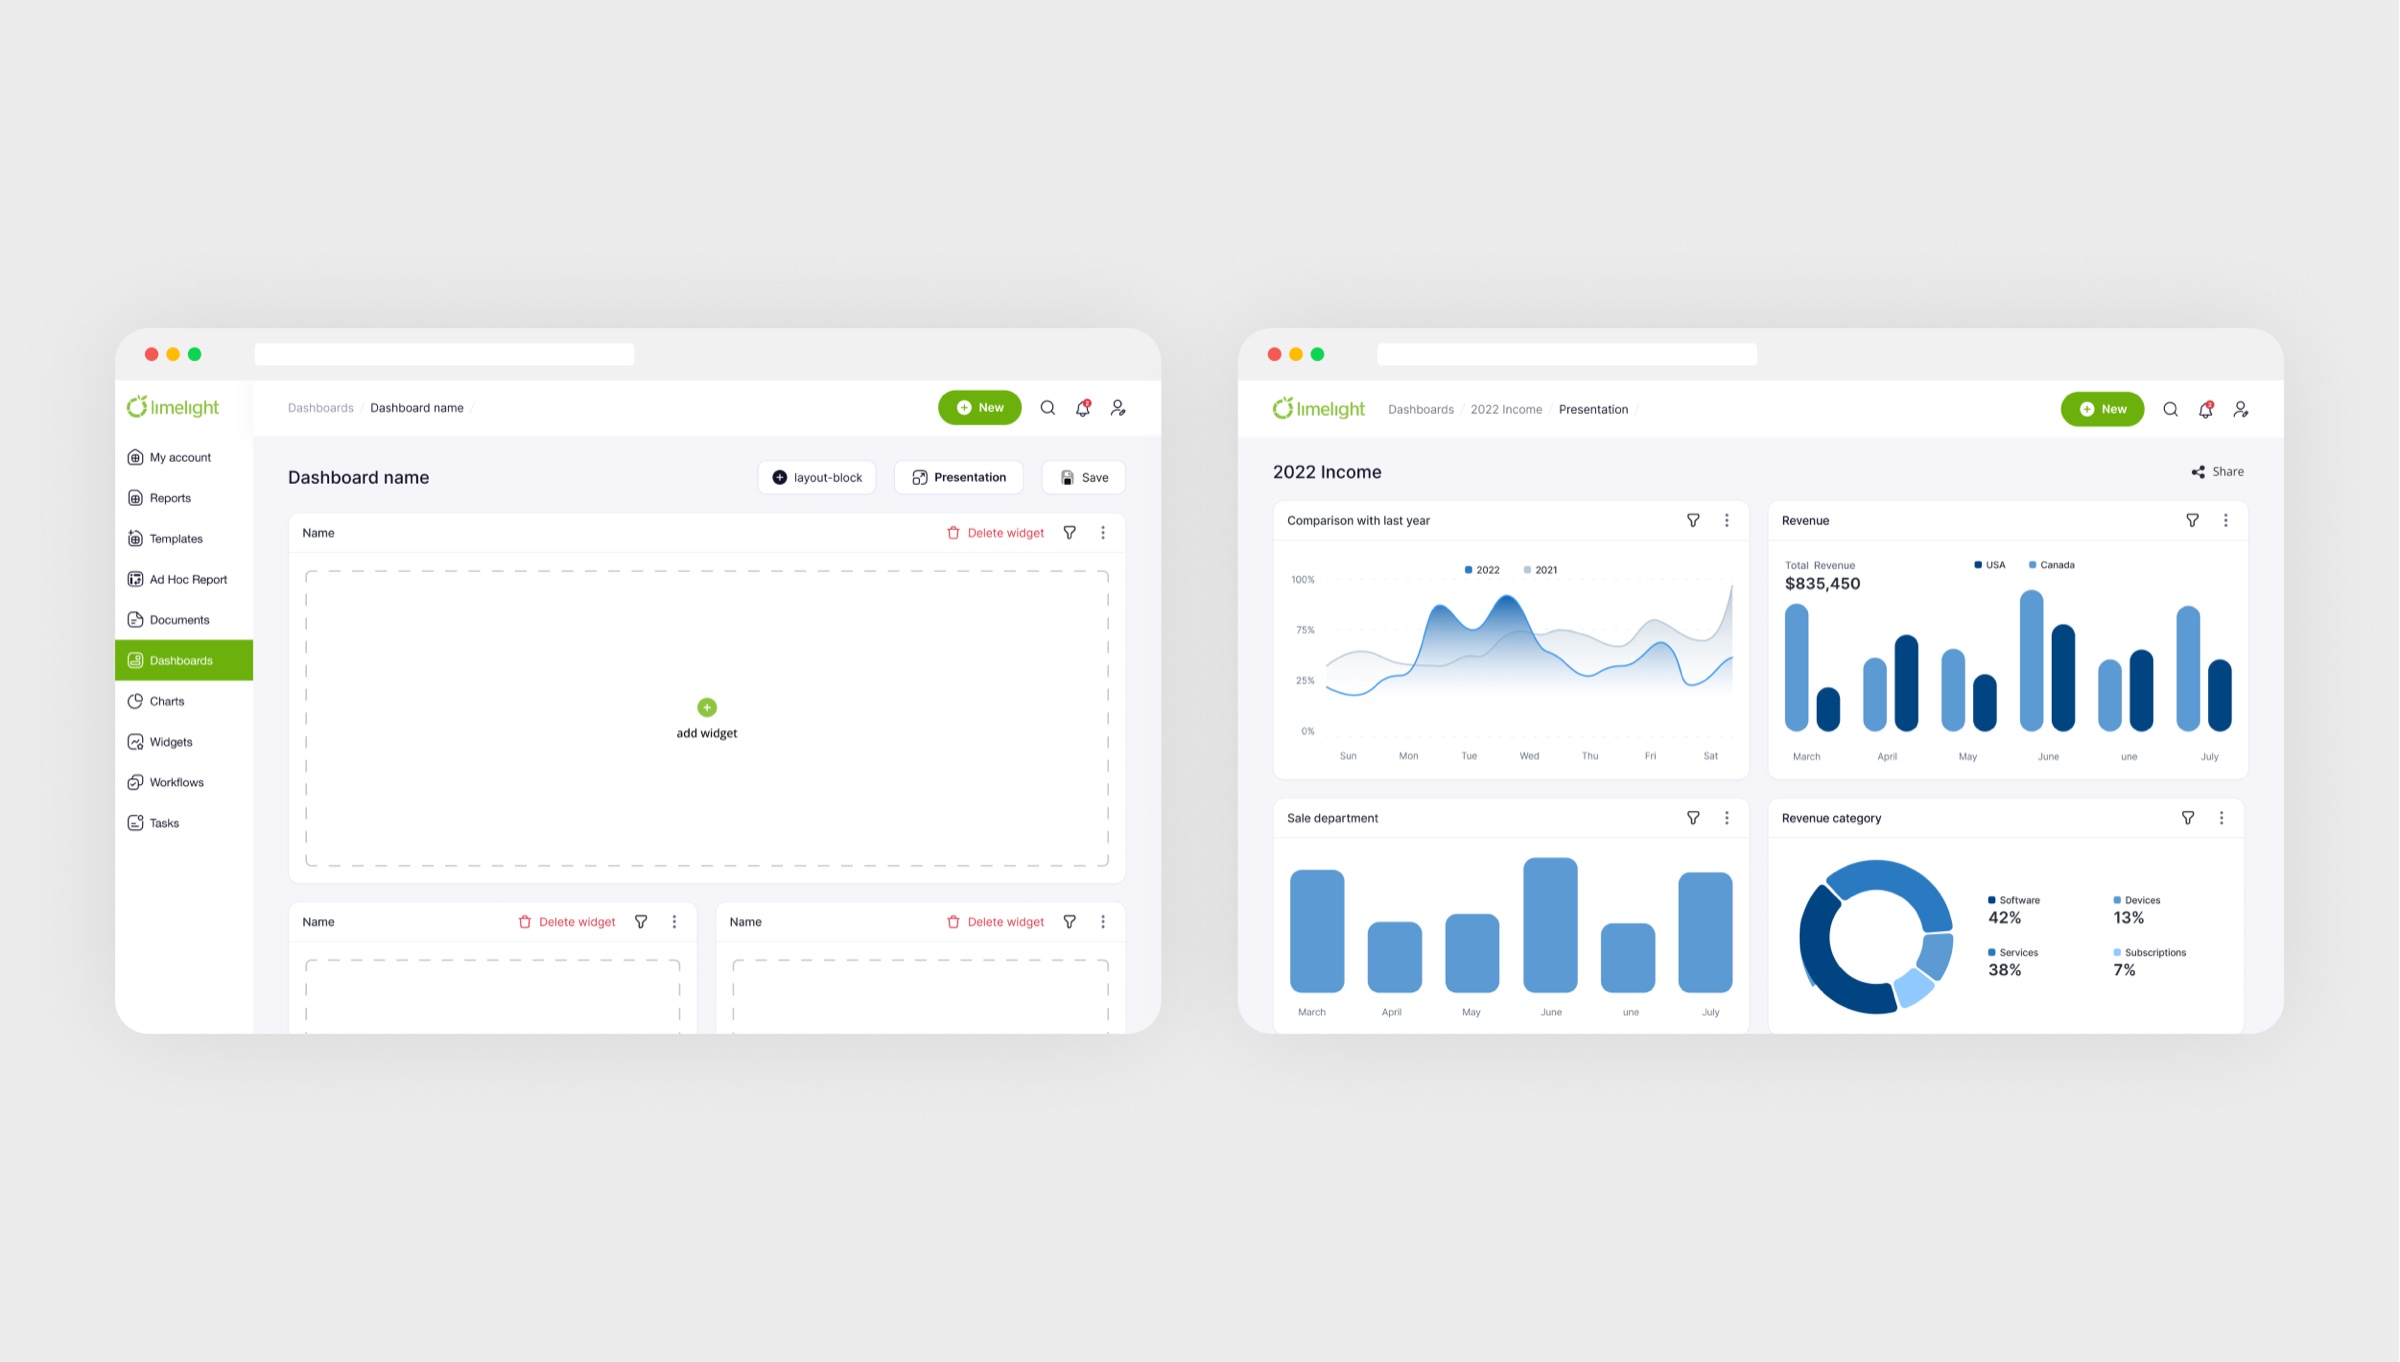
Widgets link to source files, so dashboards update themselves.
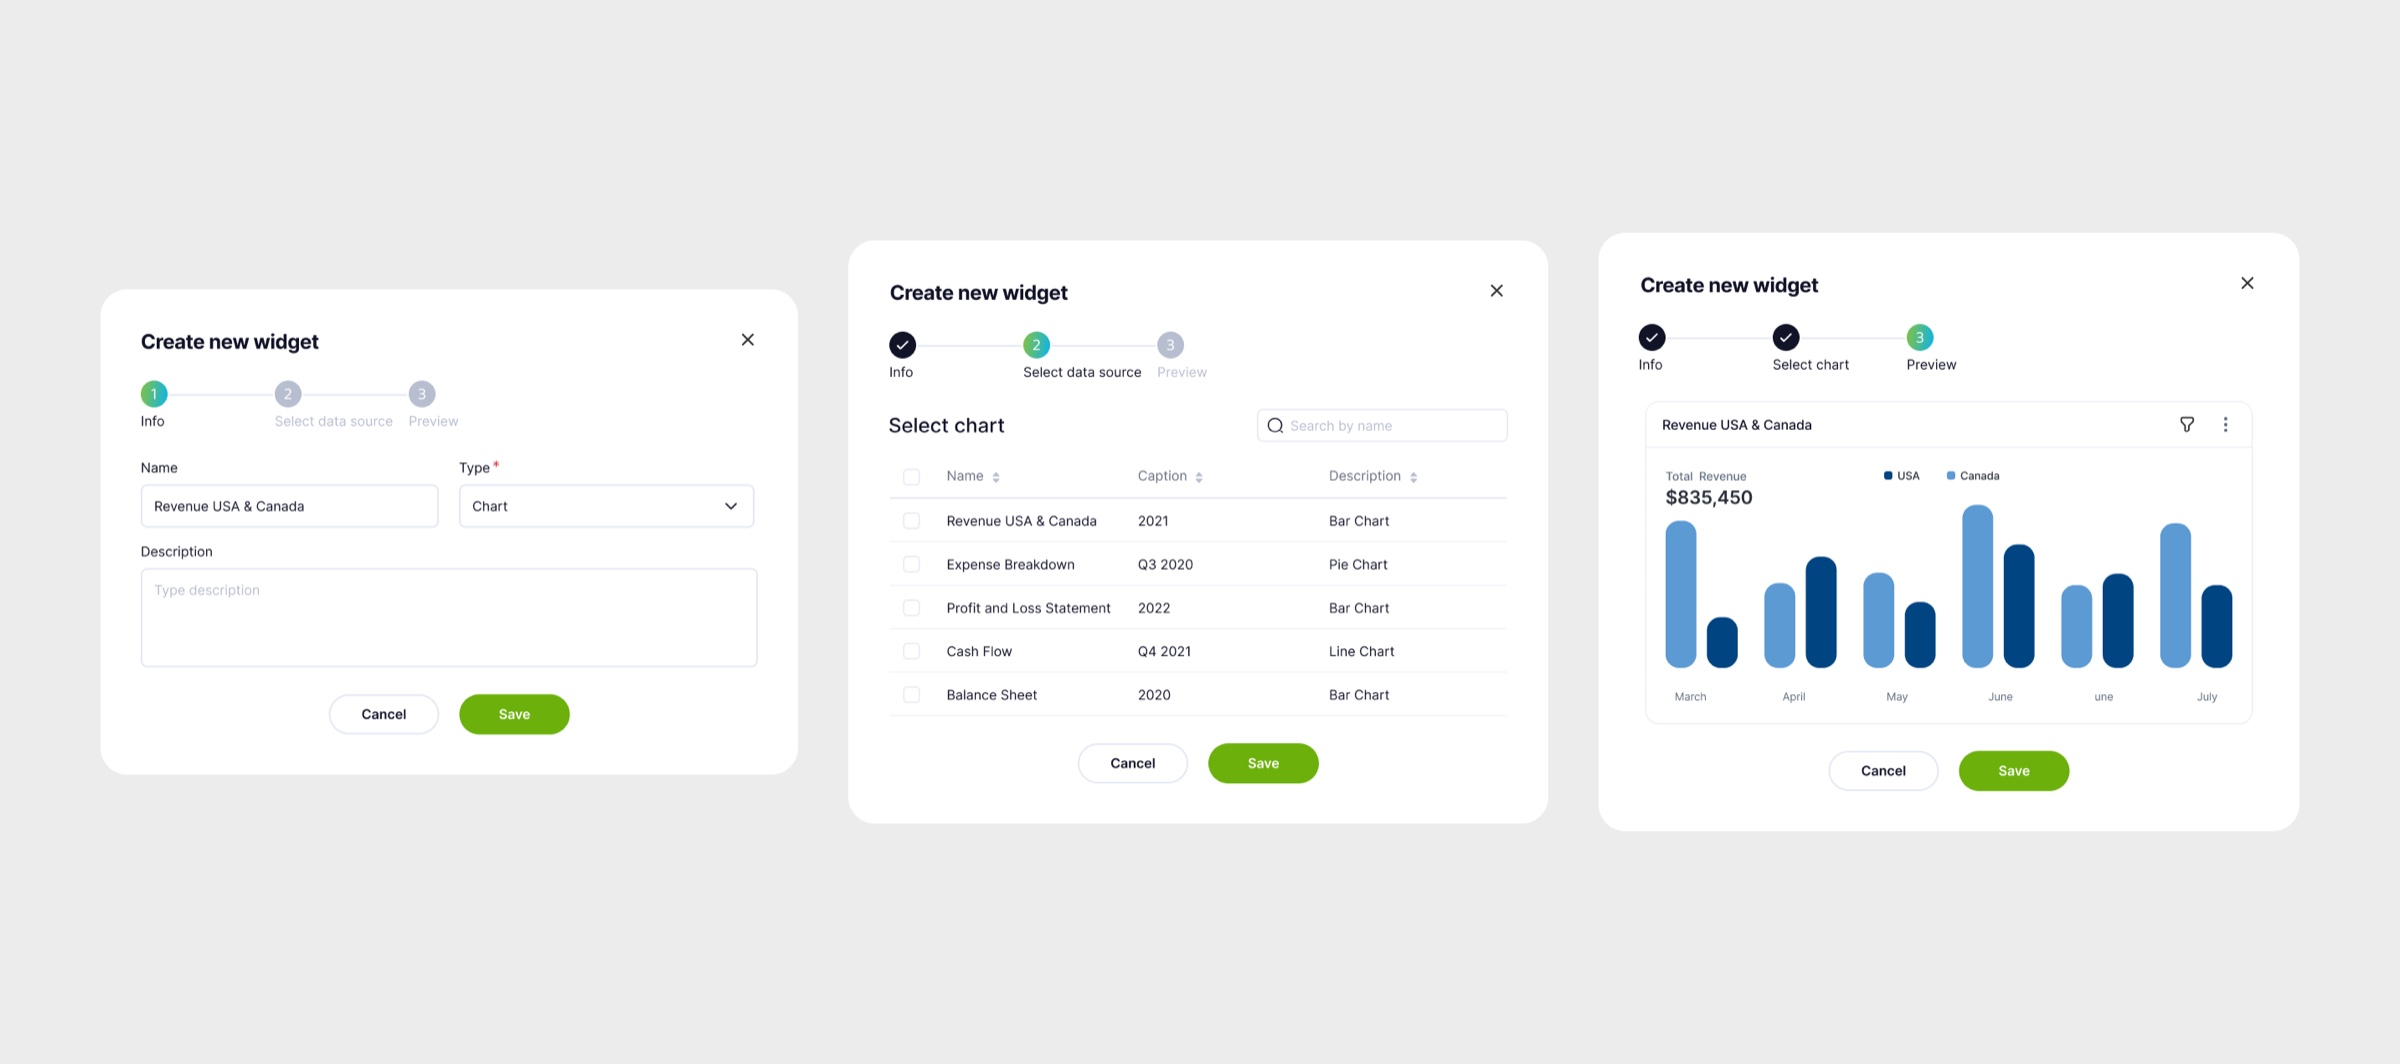
Setting up a widget
Result
A dashboard no longer starts from a blank sheet.
03
Reports & templates
Problem
Departments had to see different things inside the same file: a department head enters their own figures and sees nobody else's, while only management sees the whole picture. A permission model that is flexible and still safe took several rounds with the developers and testing on real data.
Hypothesis
If permissions are set per file and per cell, departments can work inside one report without seeing each other's figures.
Solution
Advanced tables with complex calculations and per-role access: department heads input their figures without seeing other departments; only management sees the whole picture.
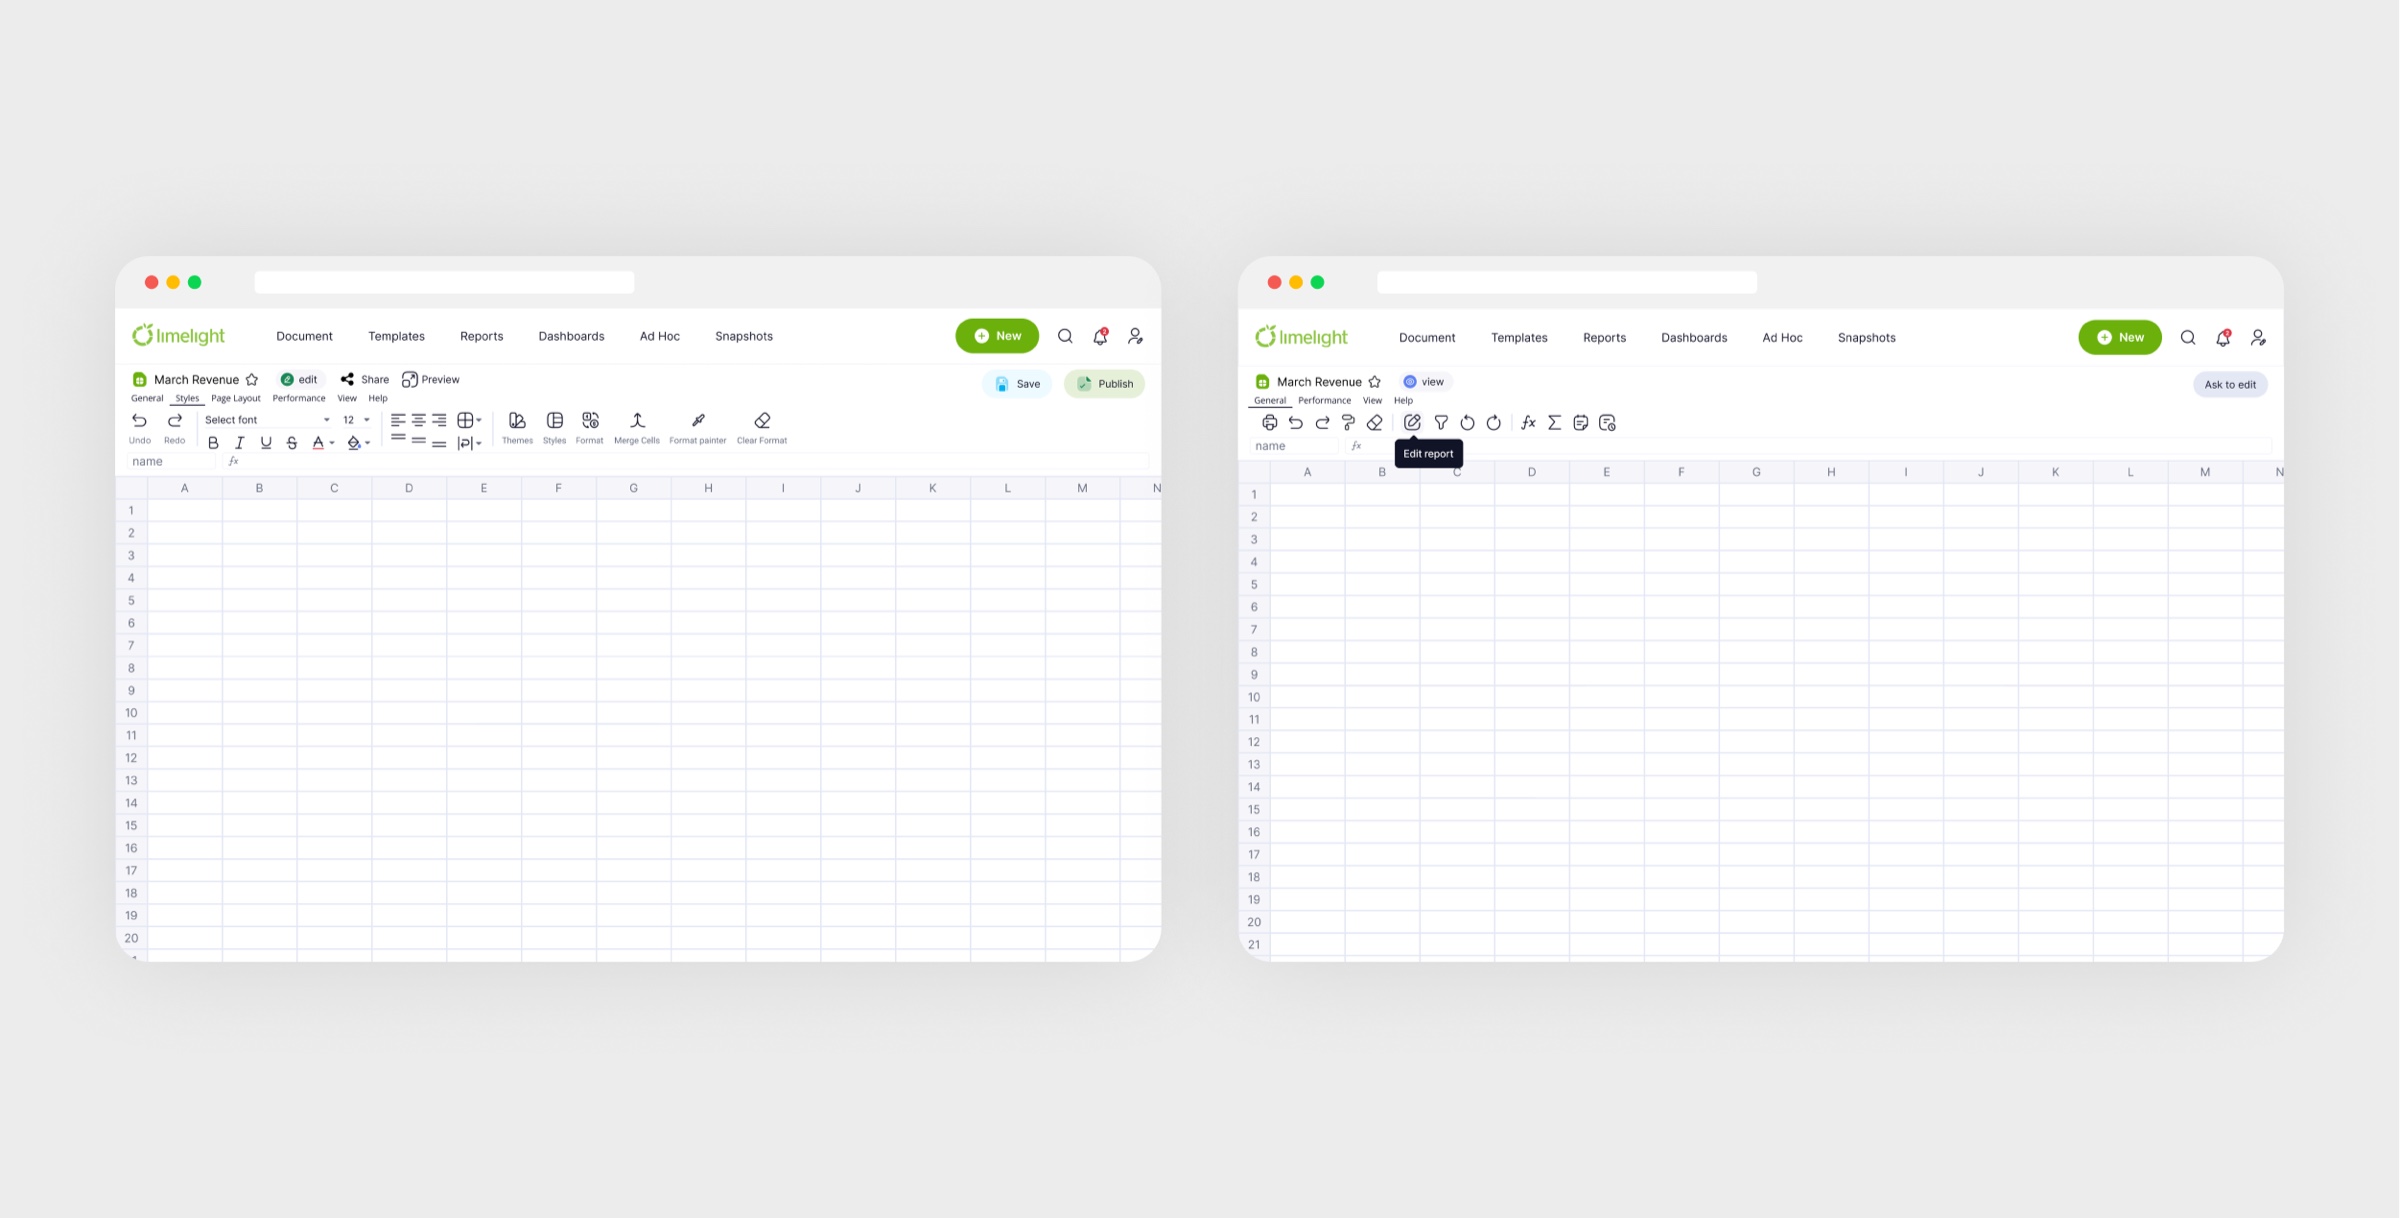
Excel's actions where accountants expect them, so there is nothing to relearn.
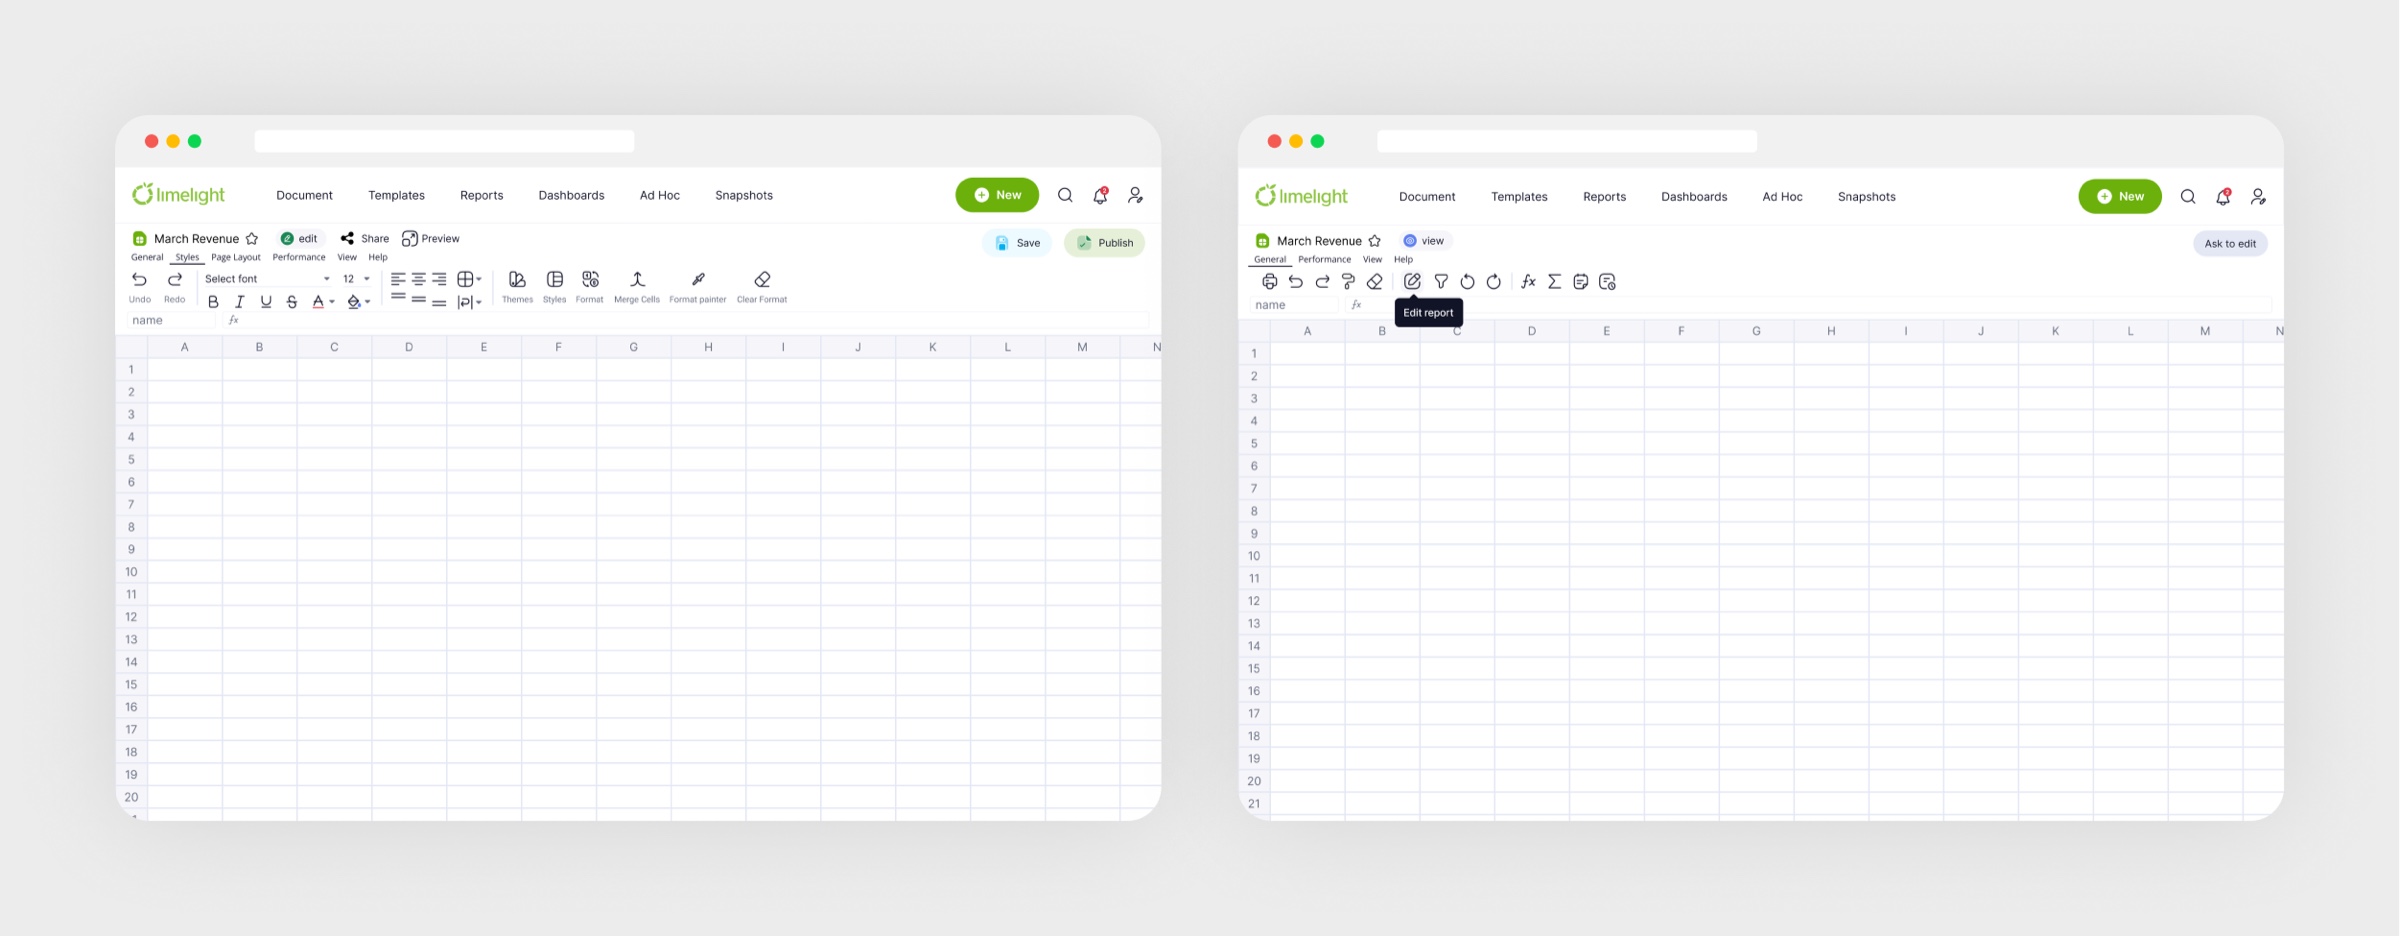
The toolbar: Excel's actions where finance people expect them
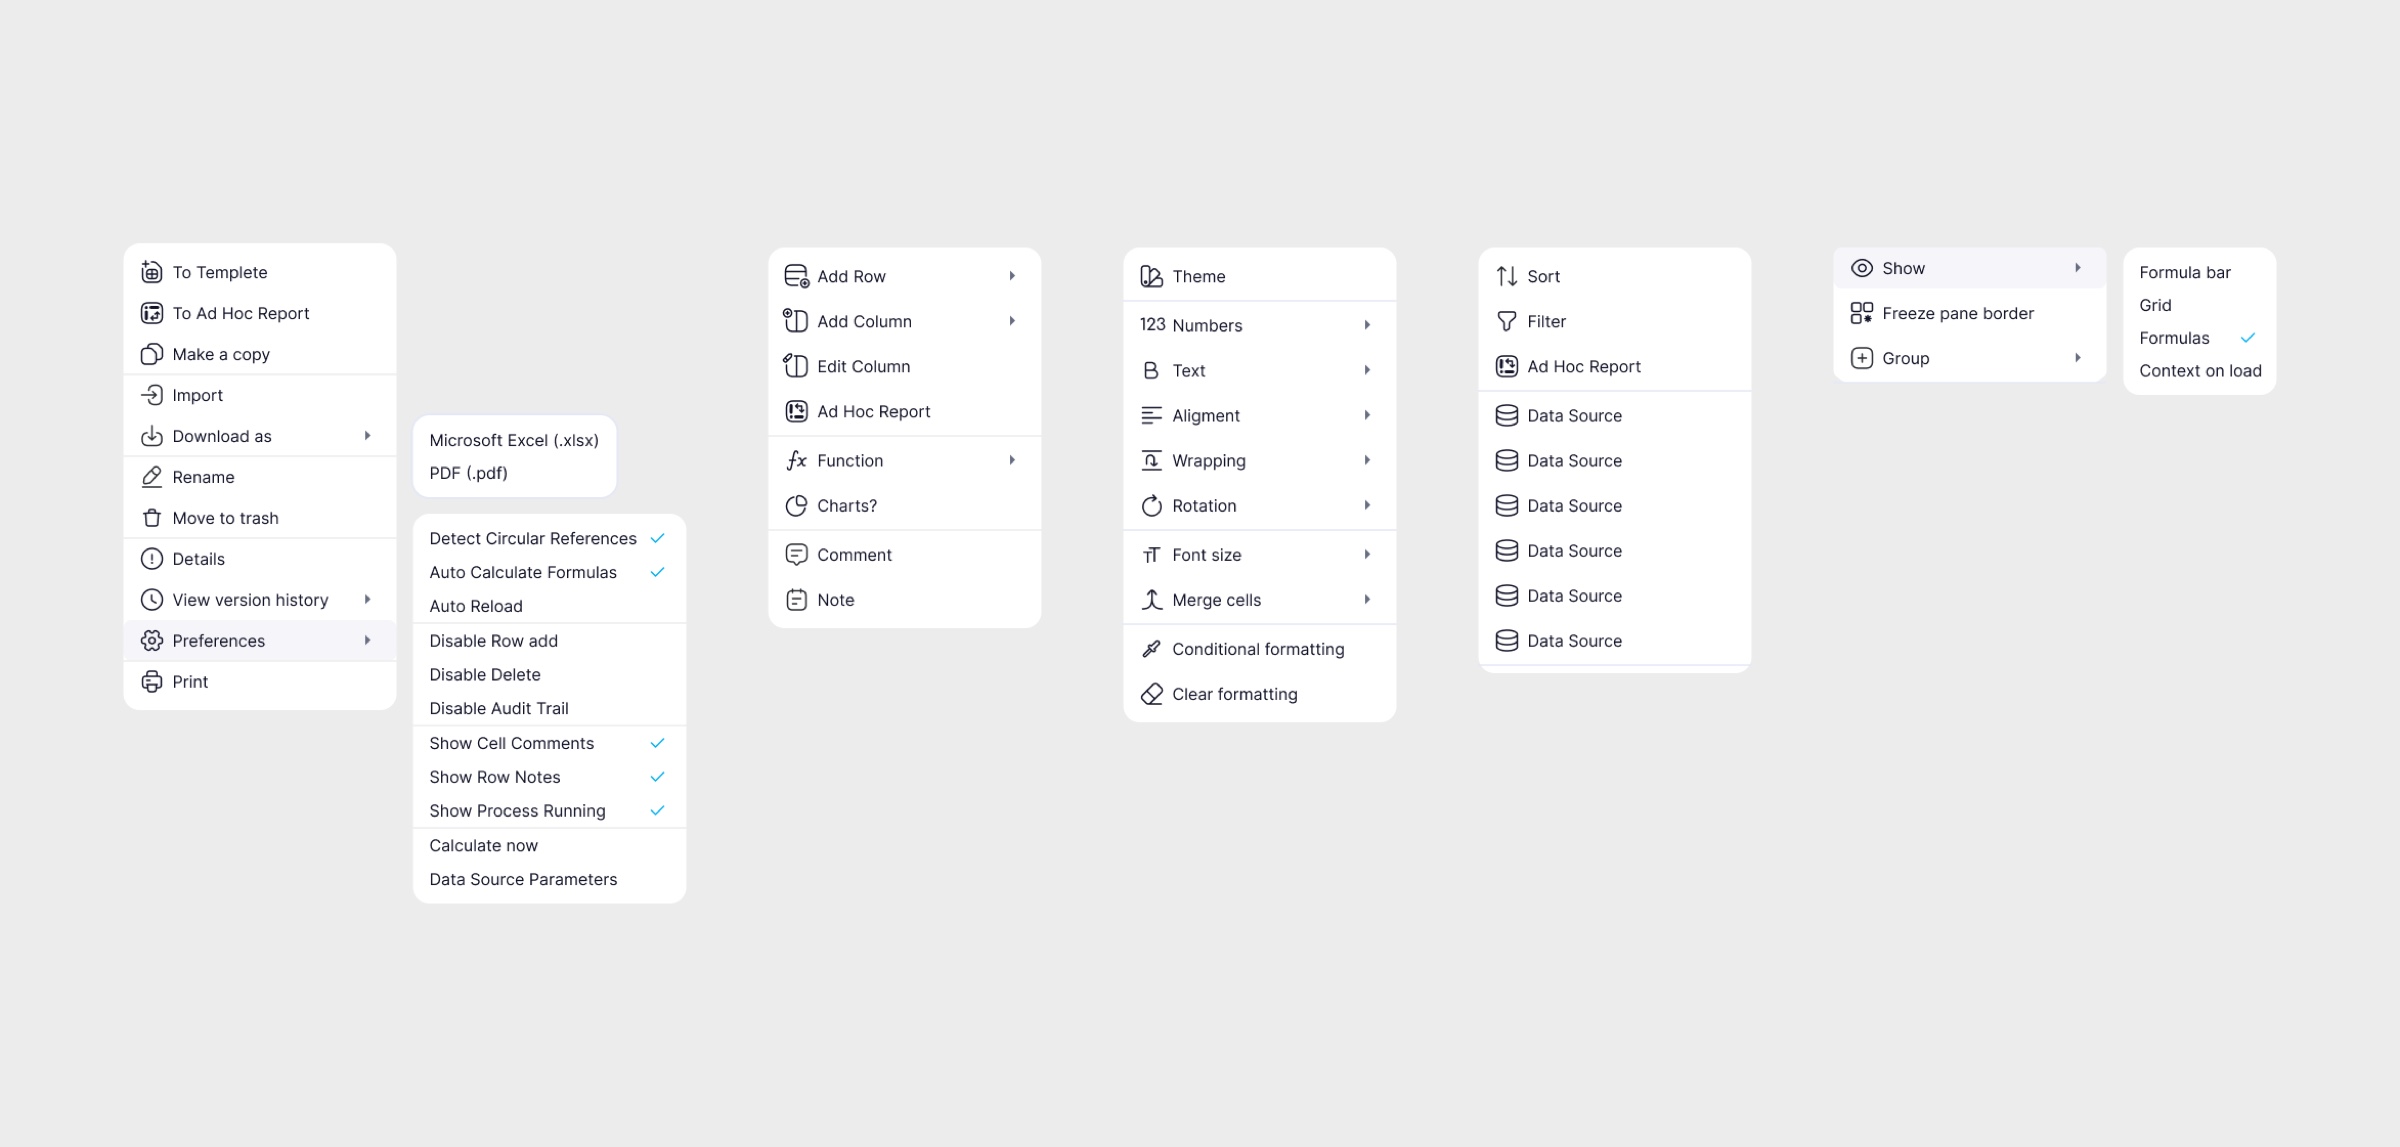
Every menu behind that toolbar
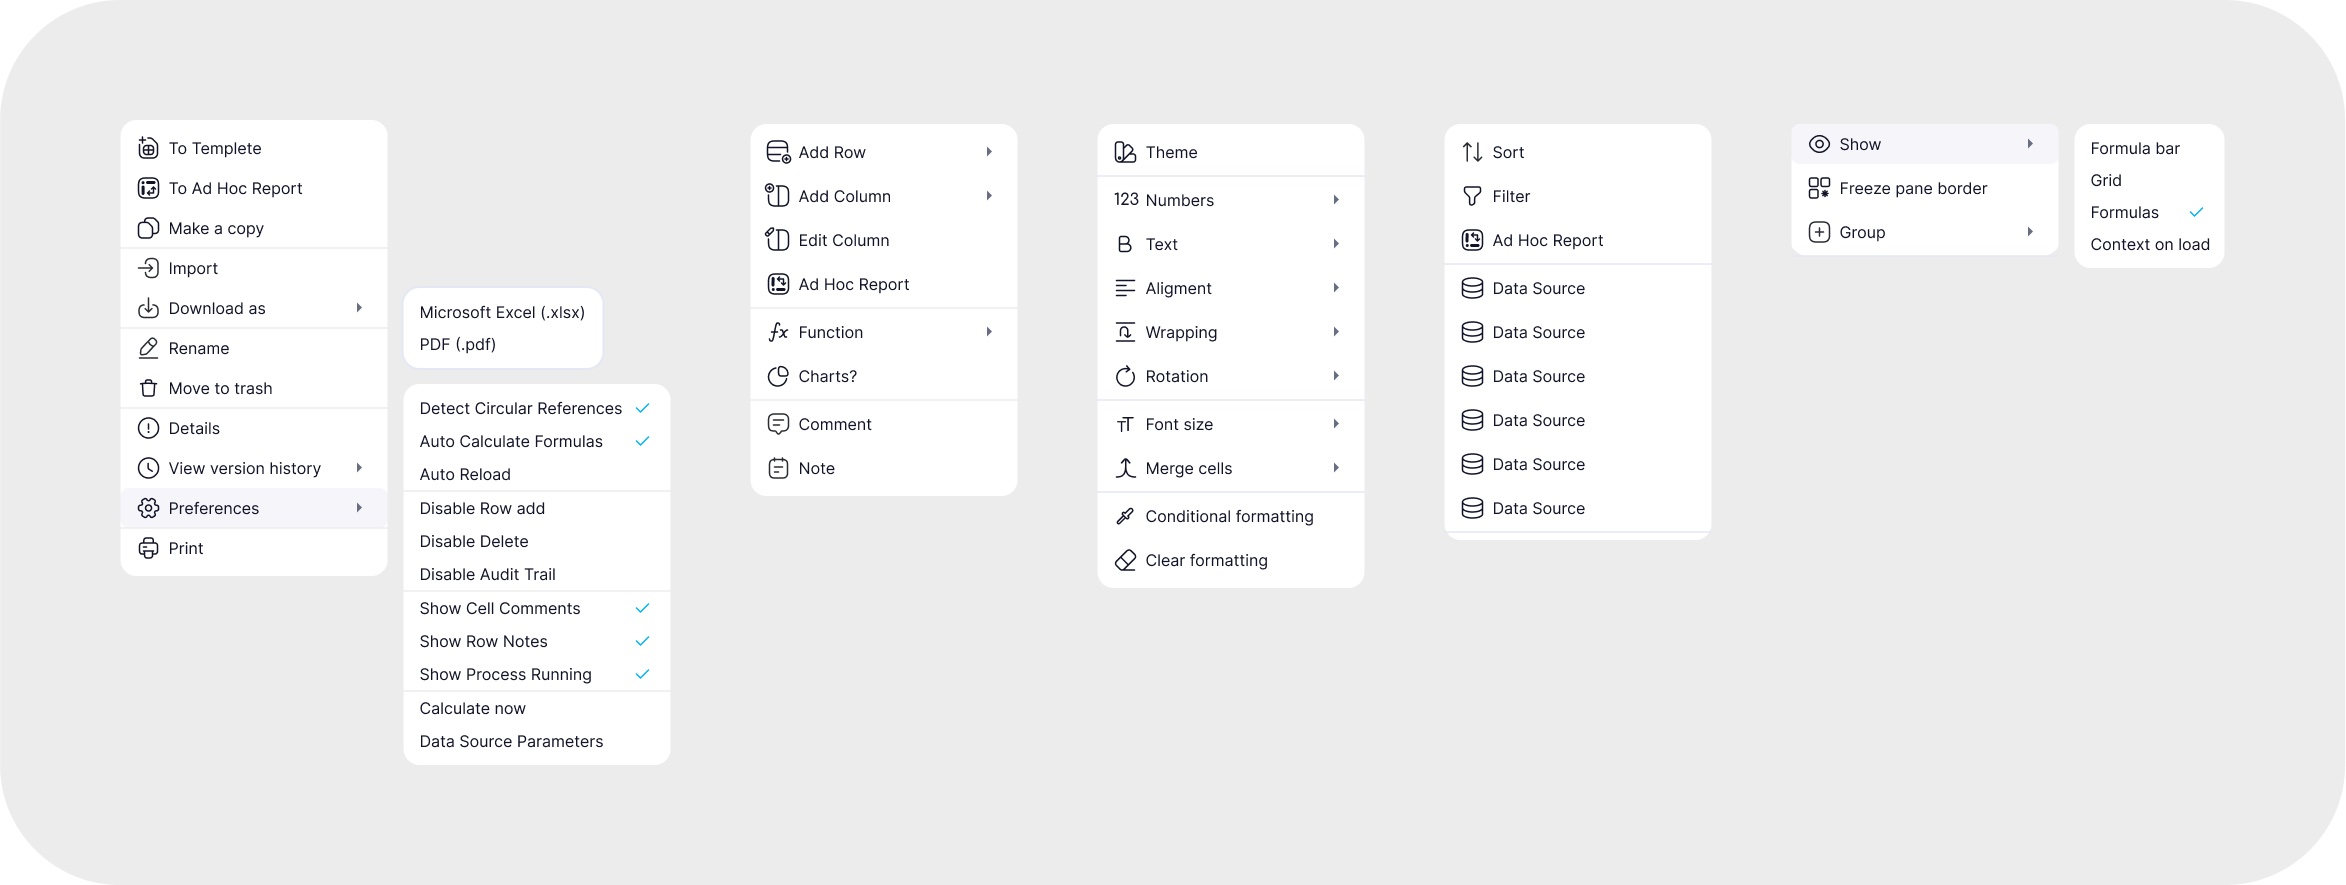
Role-based access inside one file
04
Ad Hoc reports
Problem
Every client wanted their own report template, and each one was a separate development task.
Hypothesis
If users can assemble a template themselves by picking variables, reporting stops waiting on the development queue.
Solution
Users assemble their own report templates by picking variables, which gives tailored reporting without waiting for custom development.
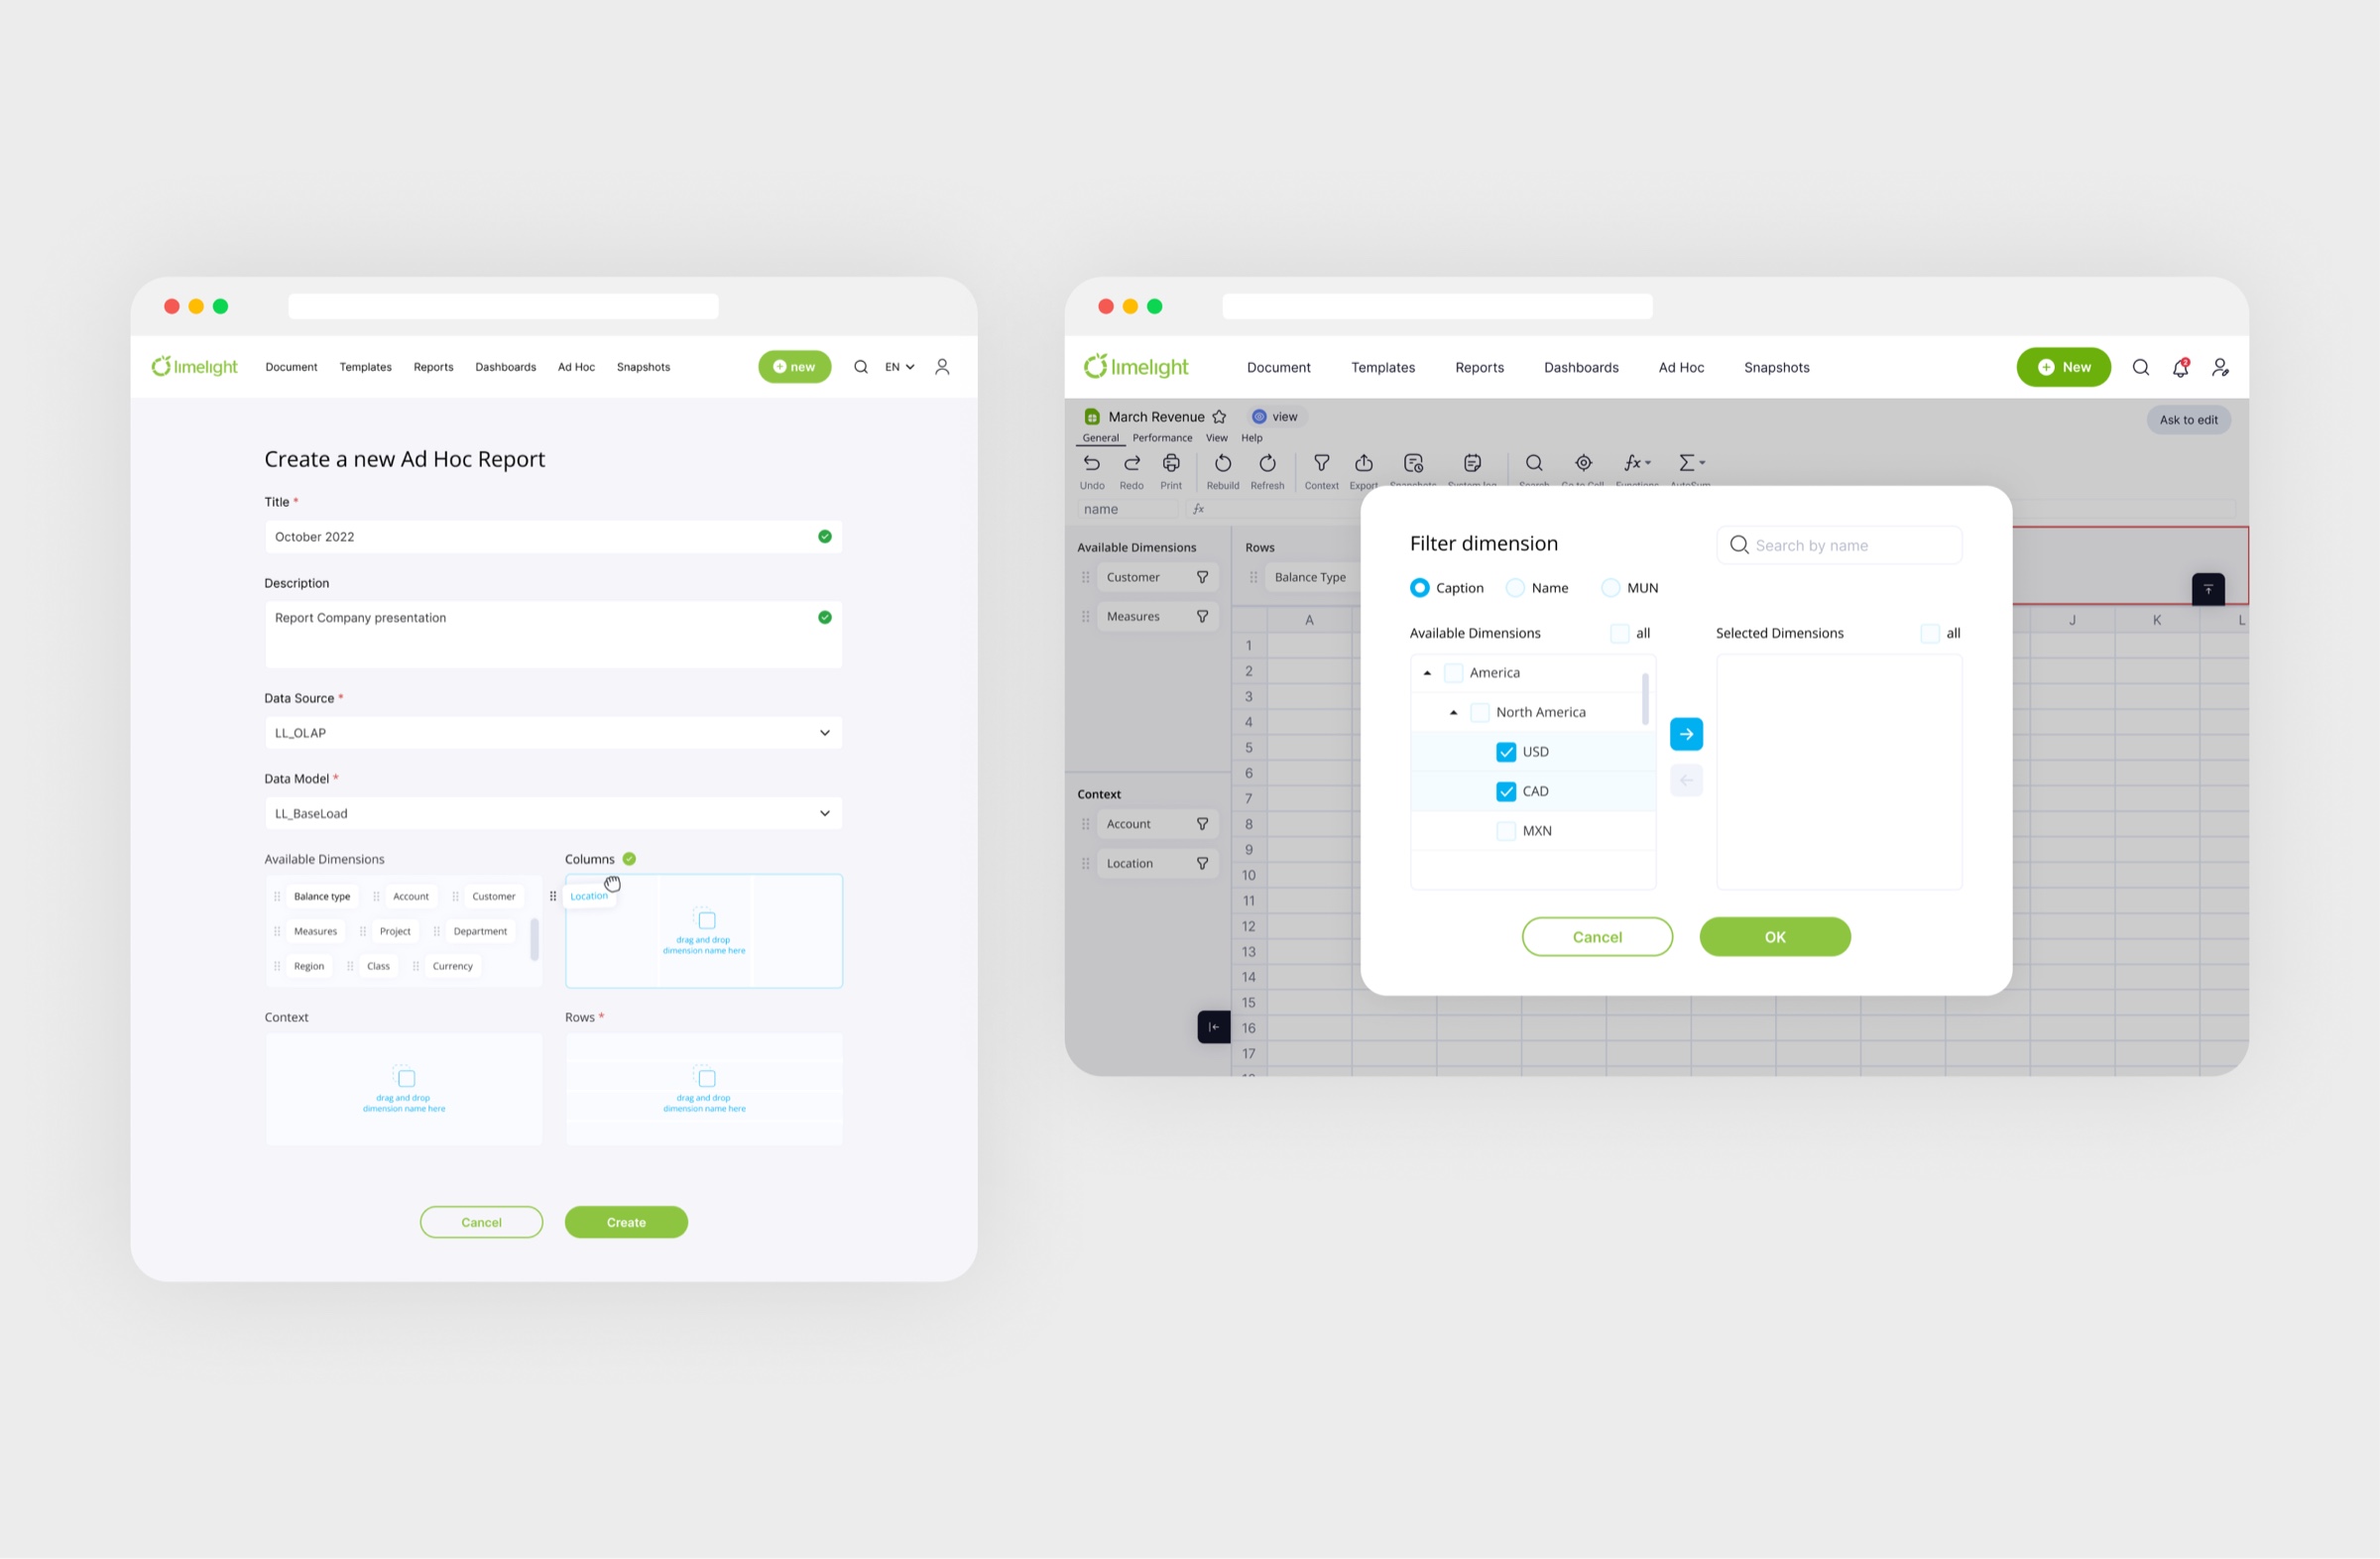
Each custom template used to be a dev ticket. Now it's a few picks.
05
Data servers
Problem
Budgeting and forecasting run on datasets nobody can read raw. The job was to make trends and anomalies legible without flattening the numbers behind them.
Hypothesis
If the data is structured by dimensions, slicing it becomes a few clicks instead of a request to engineering.
Solution
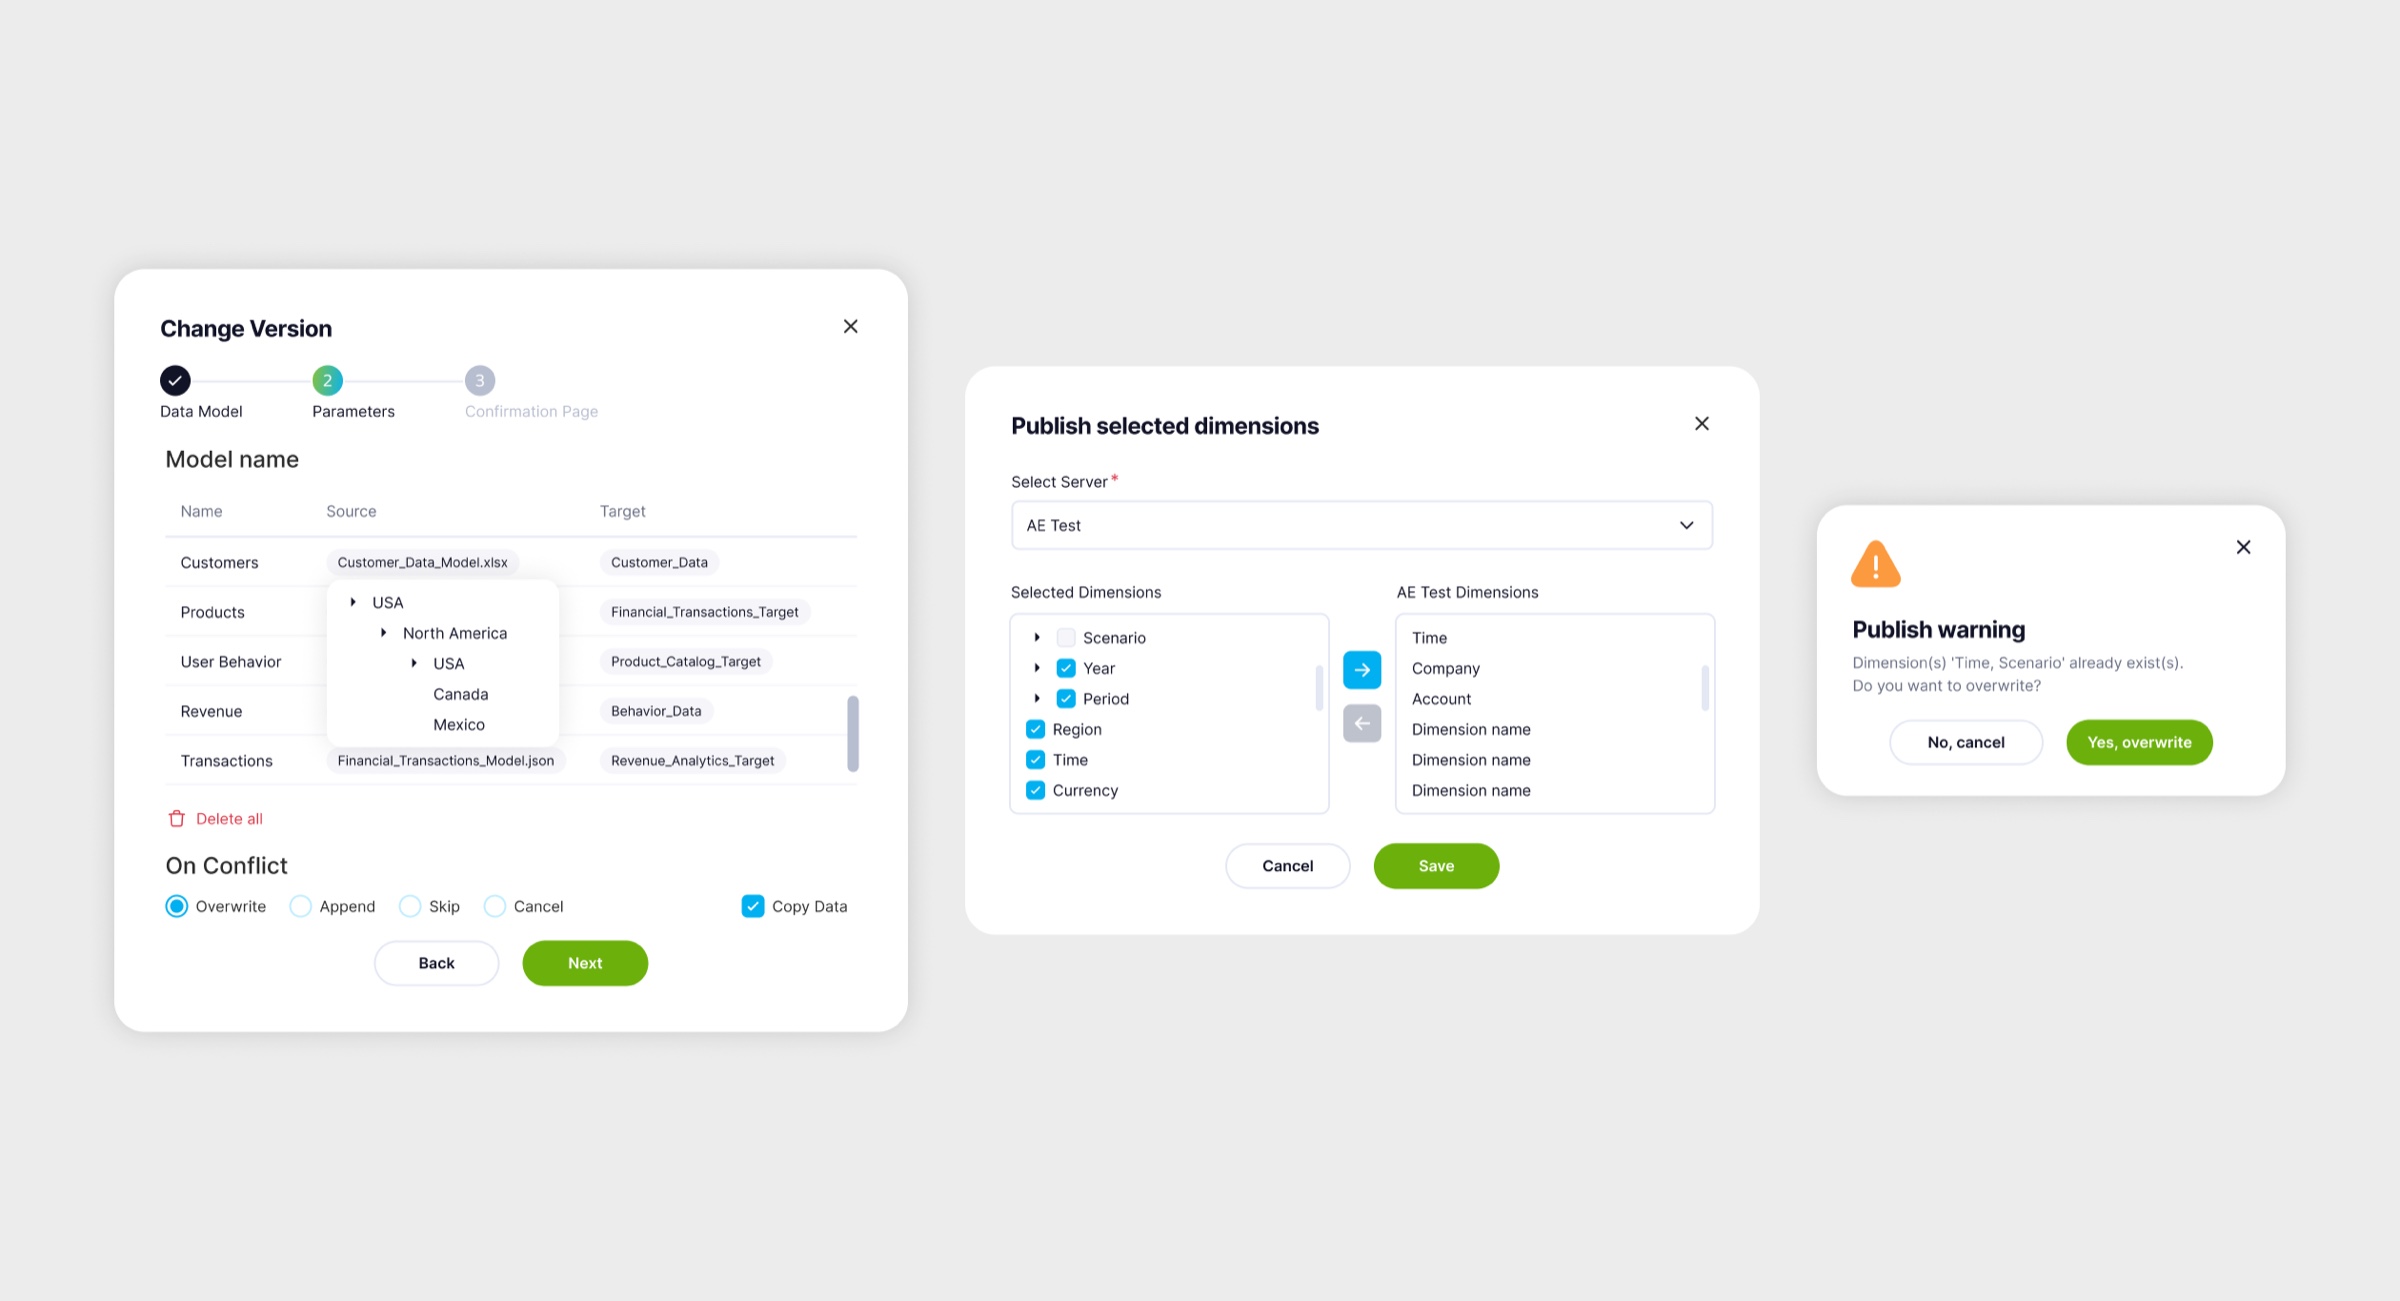
The infrastructure view: large volumes of financial data with fast access and secure storage.
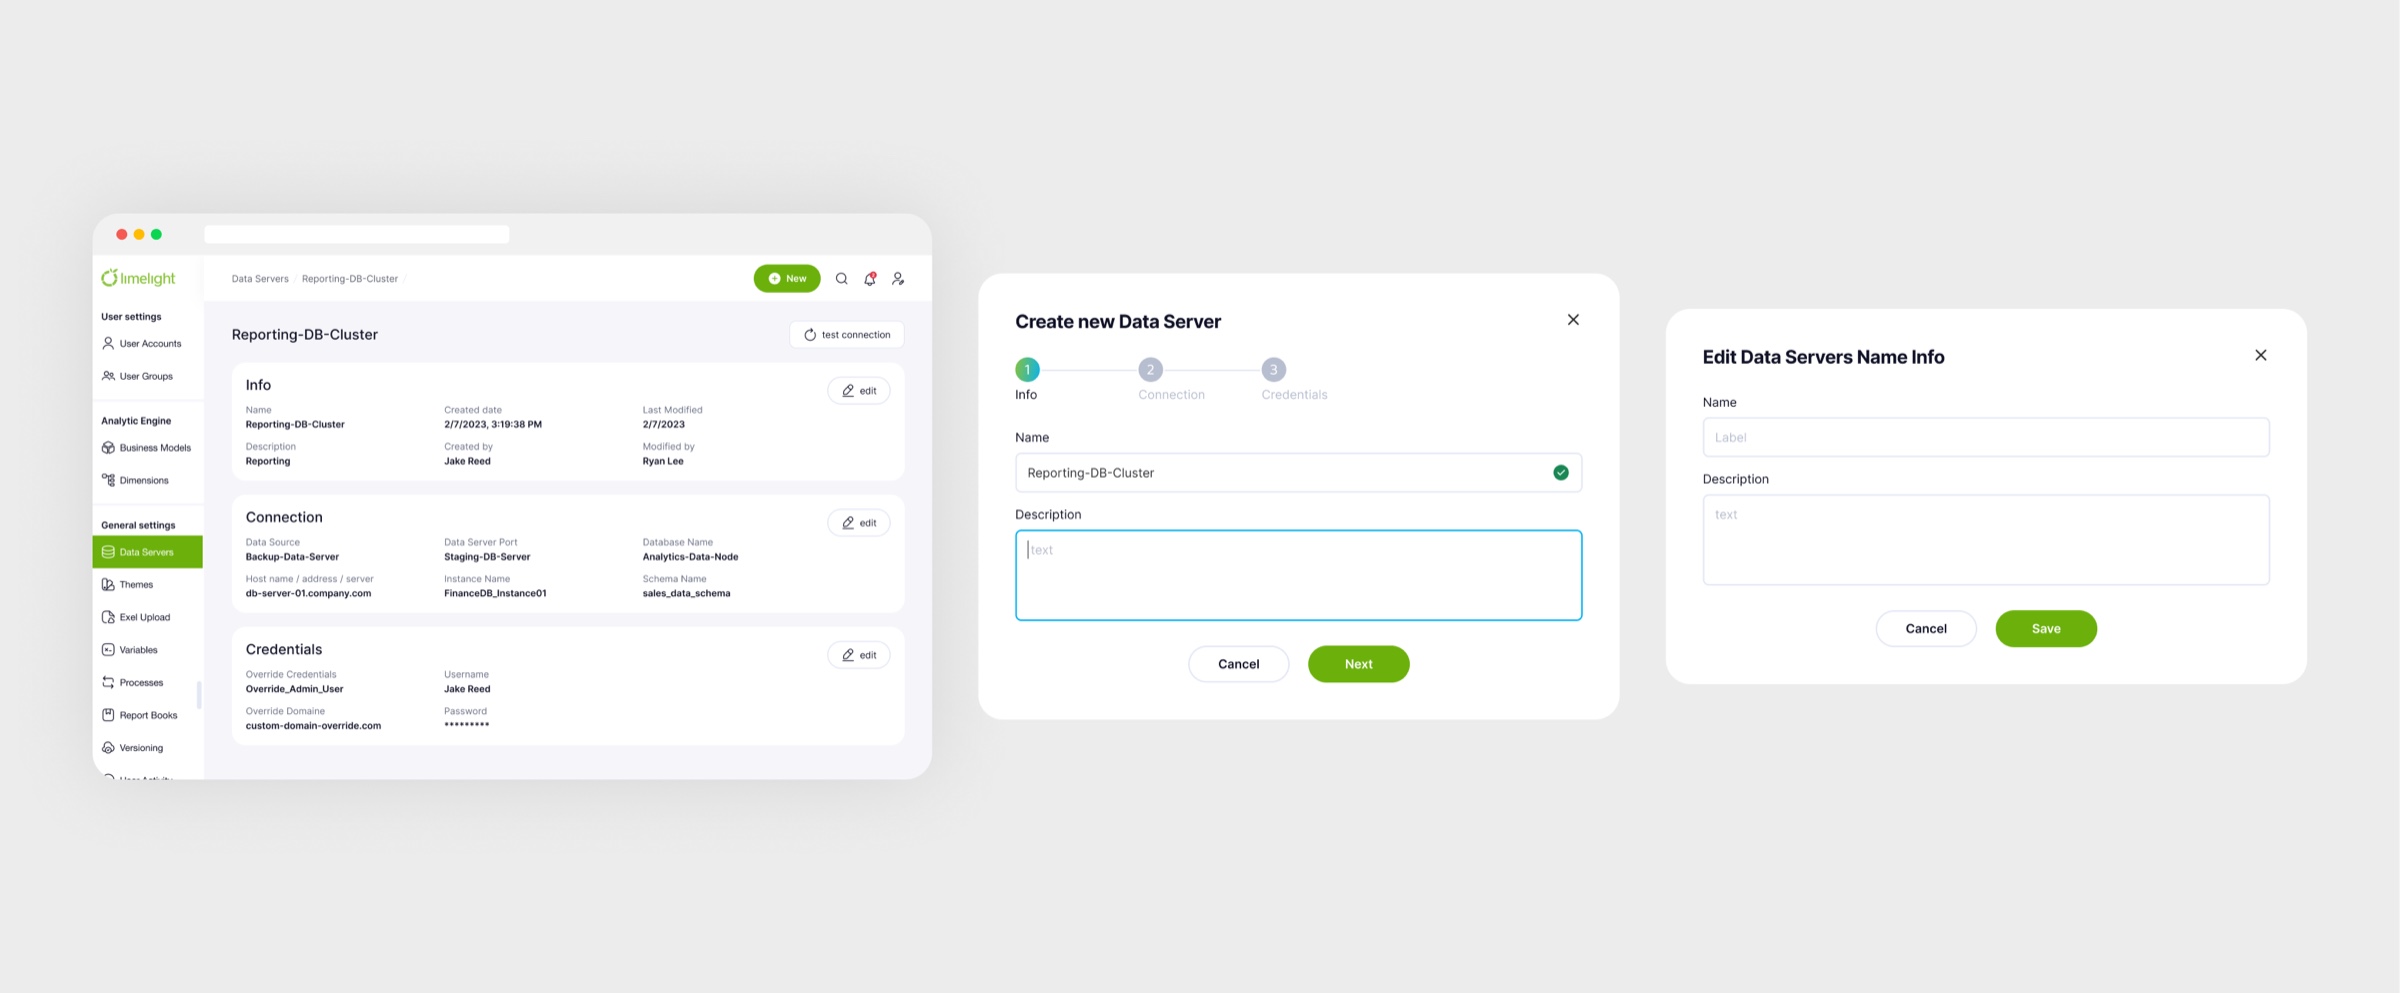
Sources and connections in one view, for the people who run them.
06
Dimensions
Problem
Financial data has to be sliced by time, region and product, and in raw tables that turned into manual work.
Hypothesis
If dimensions are modelled explicitly, slicing becomes a choice rather than a rebuild of the table.
Solution
The attributes that slice financial data, such as time, region and product type, modeled visually for analysis and reporting.
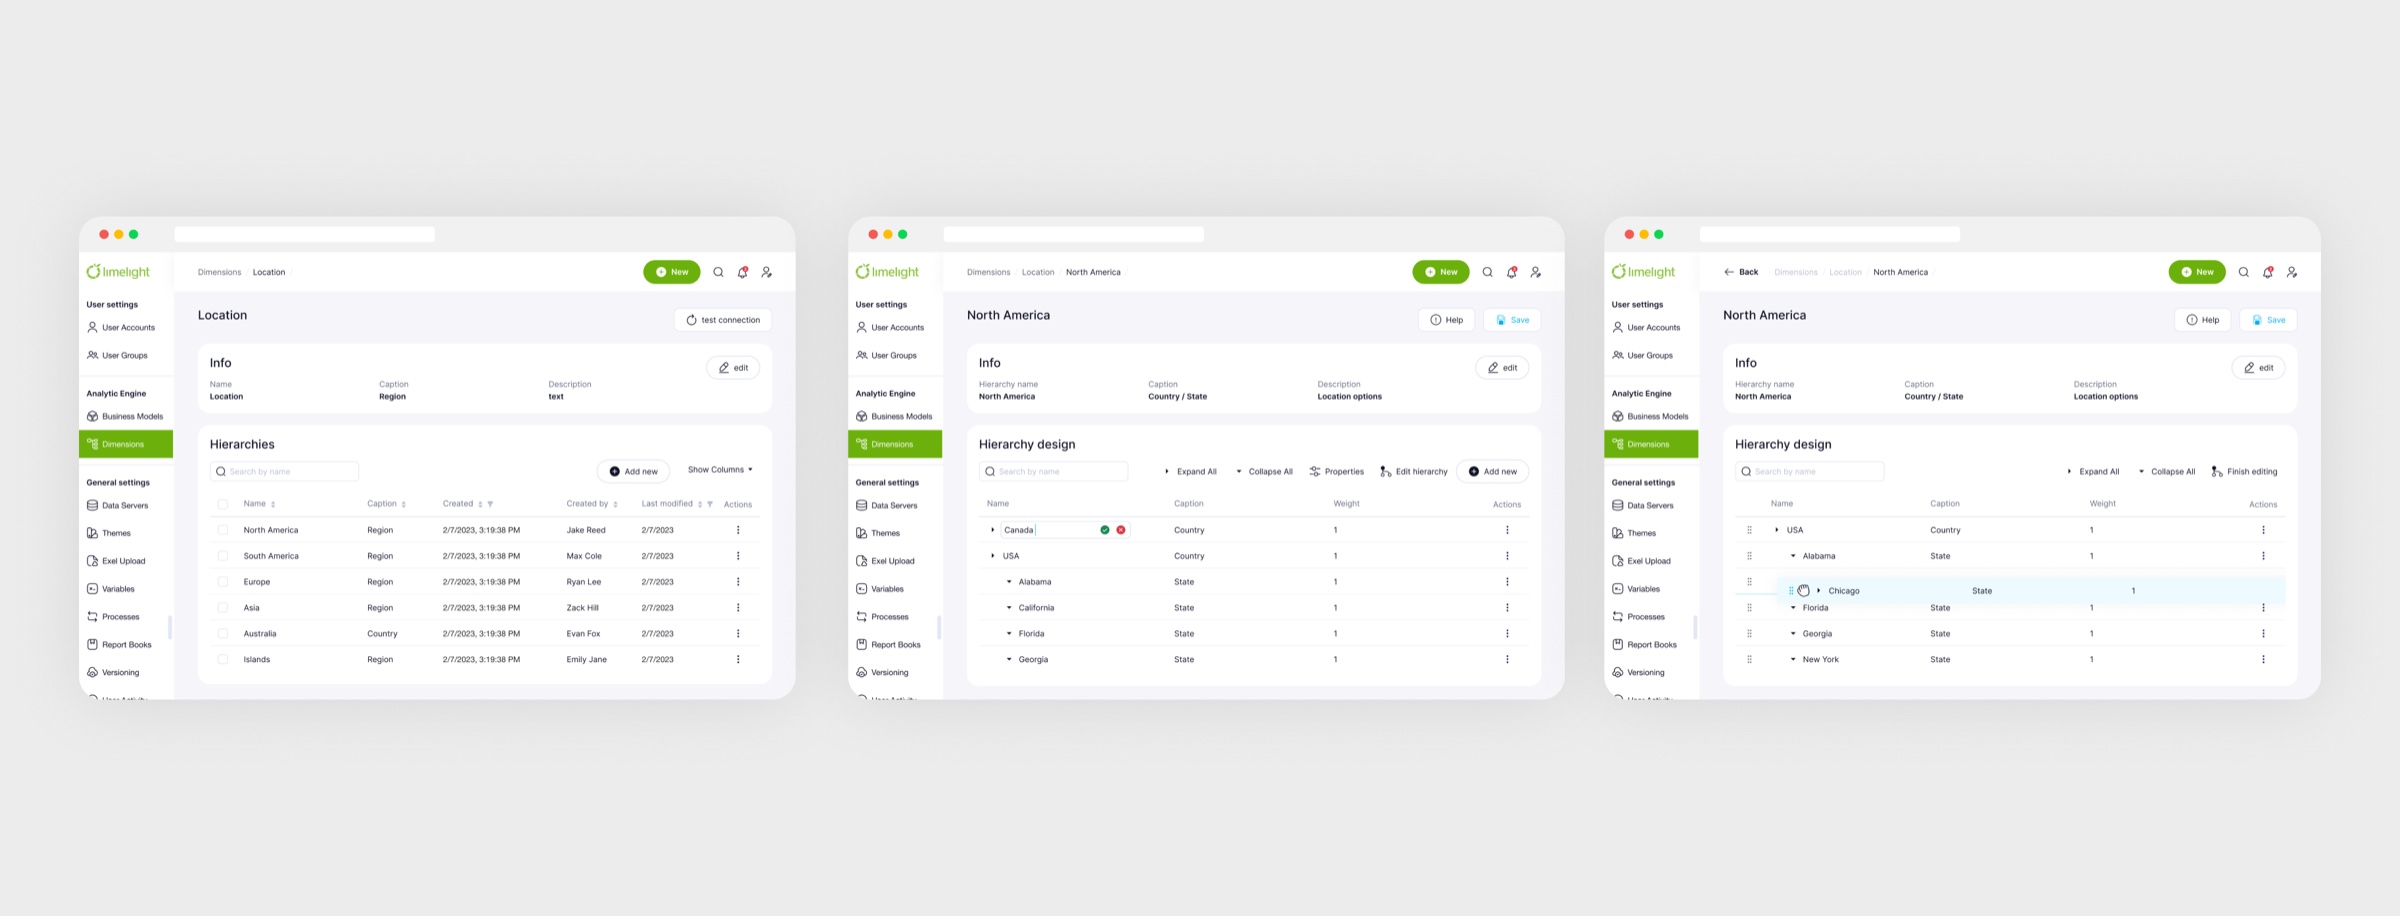
Time, region, product: the axes every report is sliced by.
Editing a dimension
07
Upload manager
Problem
Source data arrived as files from everywhere, such as spreadsheets, documents and images, and lived outside the system.
Hypothesis
If everything uploads and lives in one place, the sources behind the numbers stop going missing.
Solution
Excel files, documents and images uploaded and organized in one place.
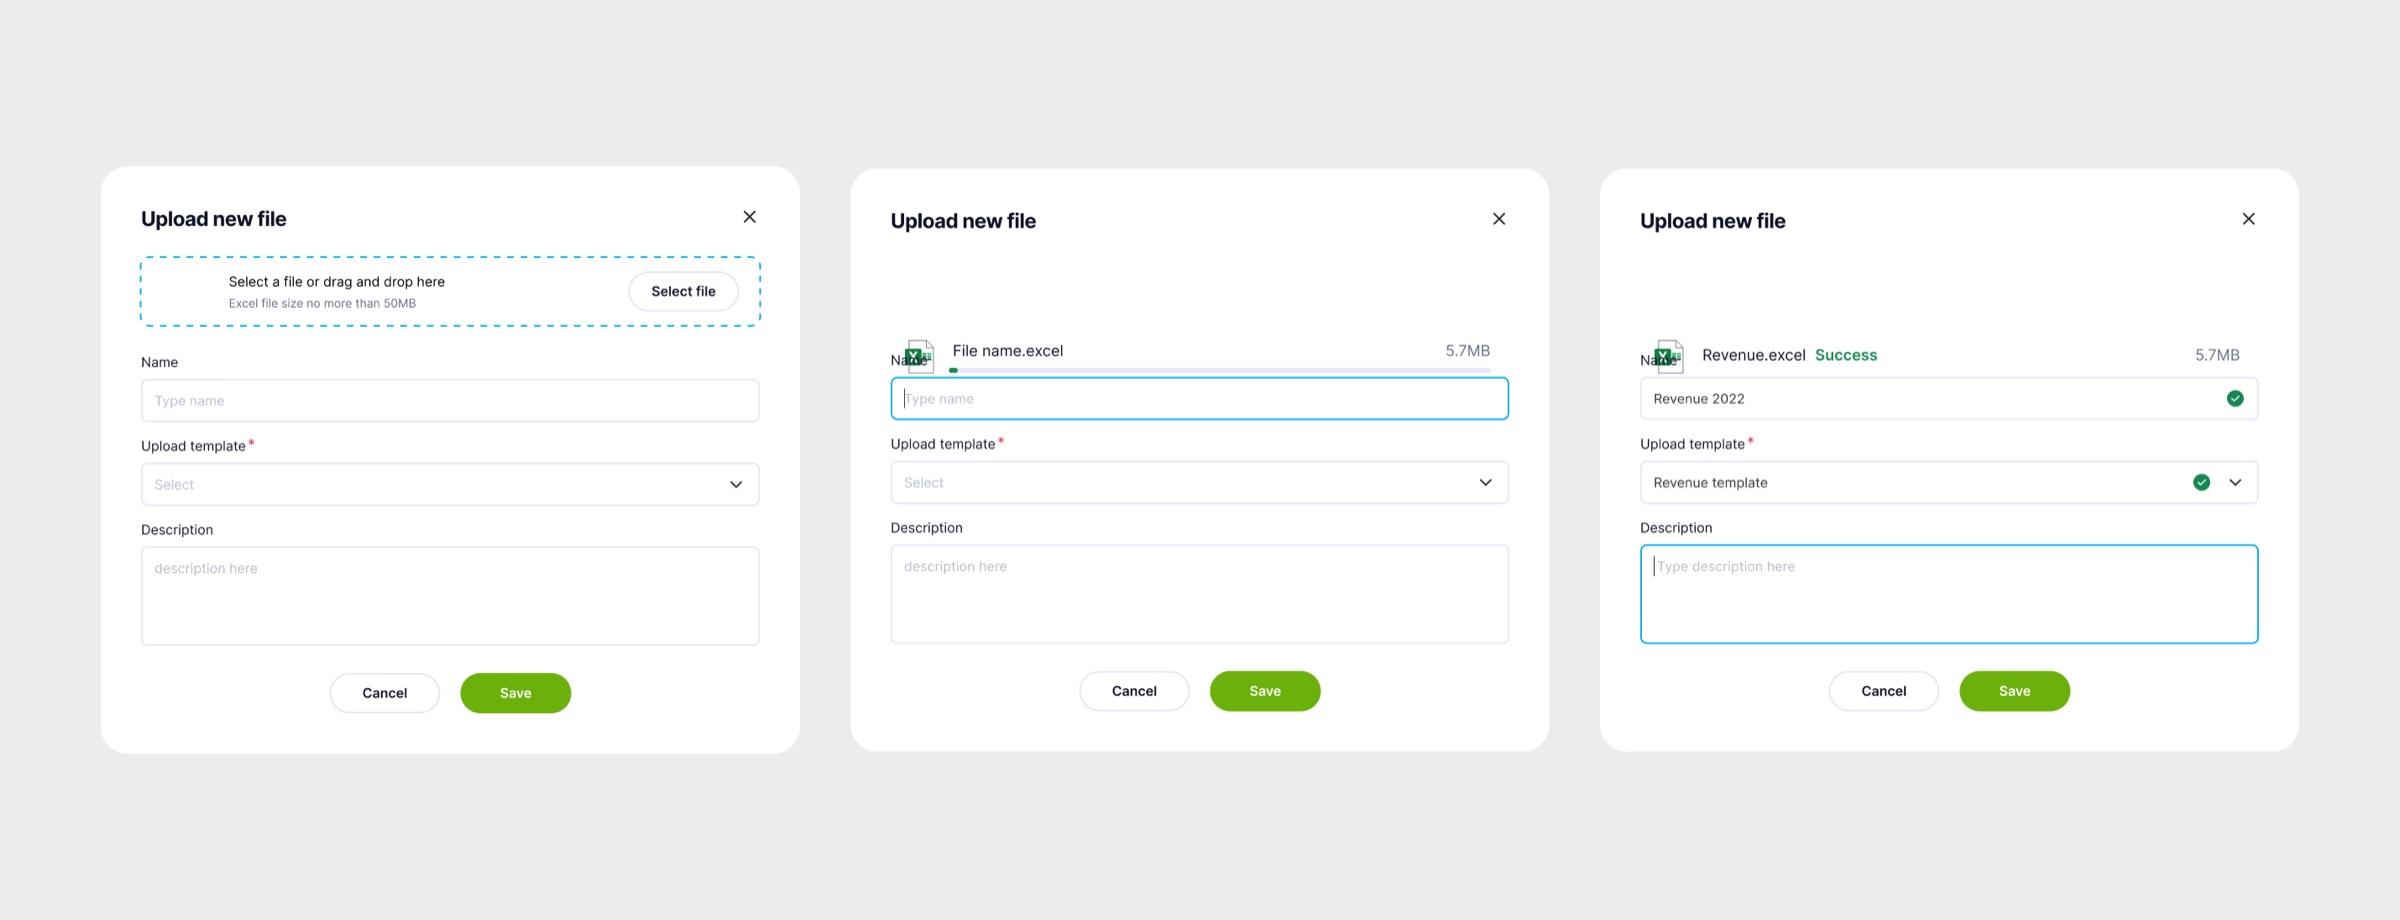
Excel files, docs and images in one place, ready for reports.
08
Users & user groups
Problem
Access was configured person by person and file by file, and every new department made that less manageable.
Hypothesis
If permissions go to role-based groups, access scales with the company instead of against it.
Solution
Per-file permissions for viewing and editing; users belong to multiple groups, so access is configured by role instead of person by person.
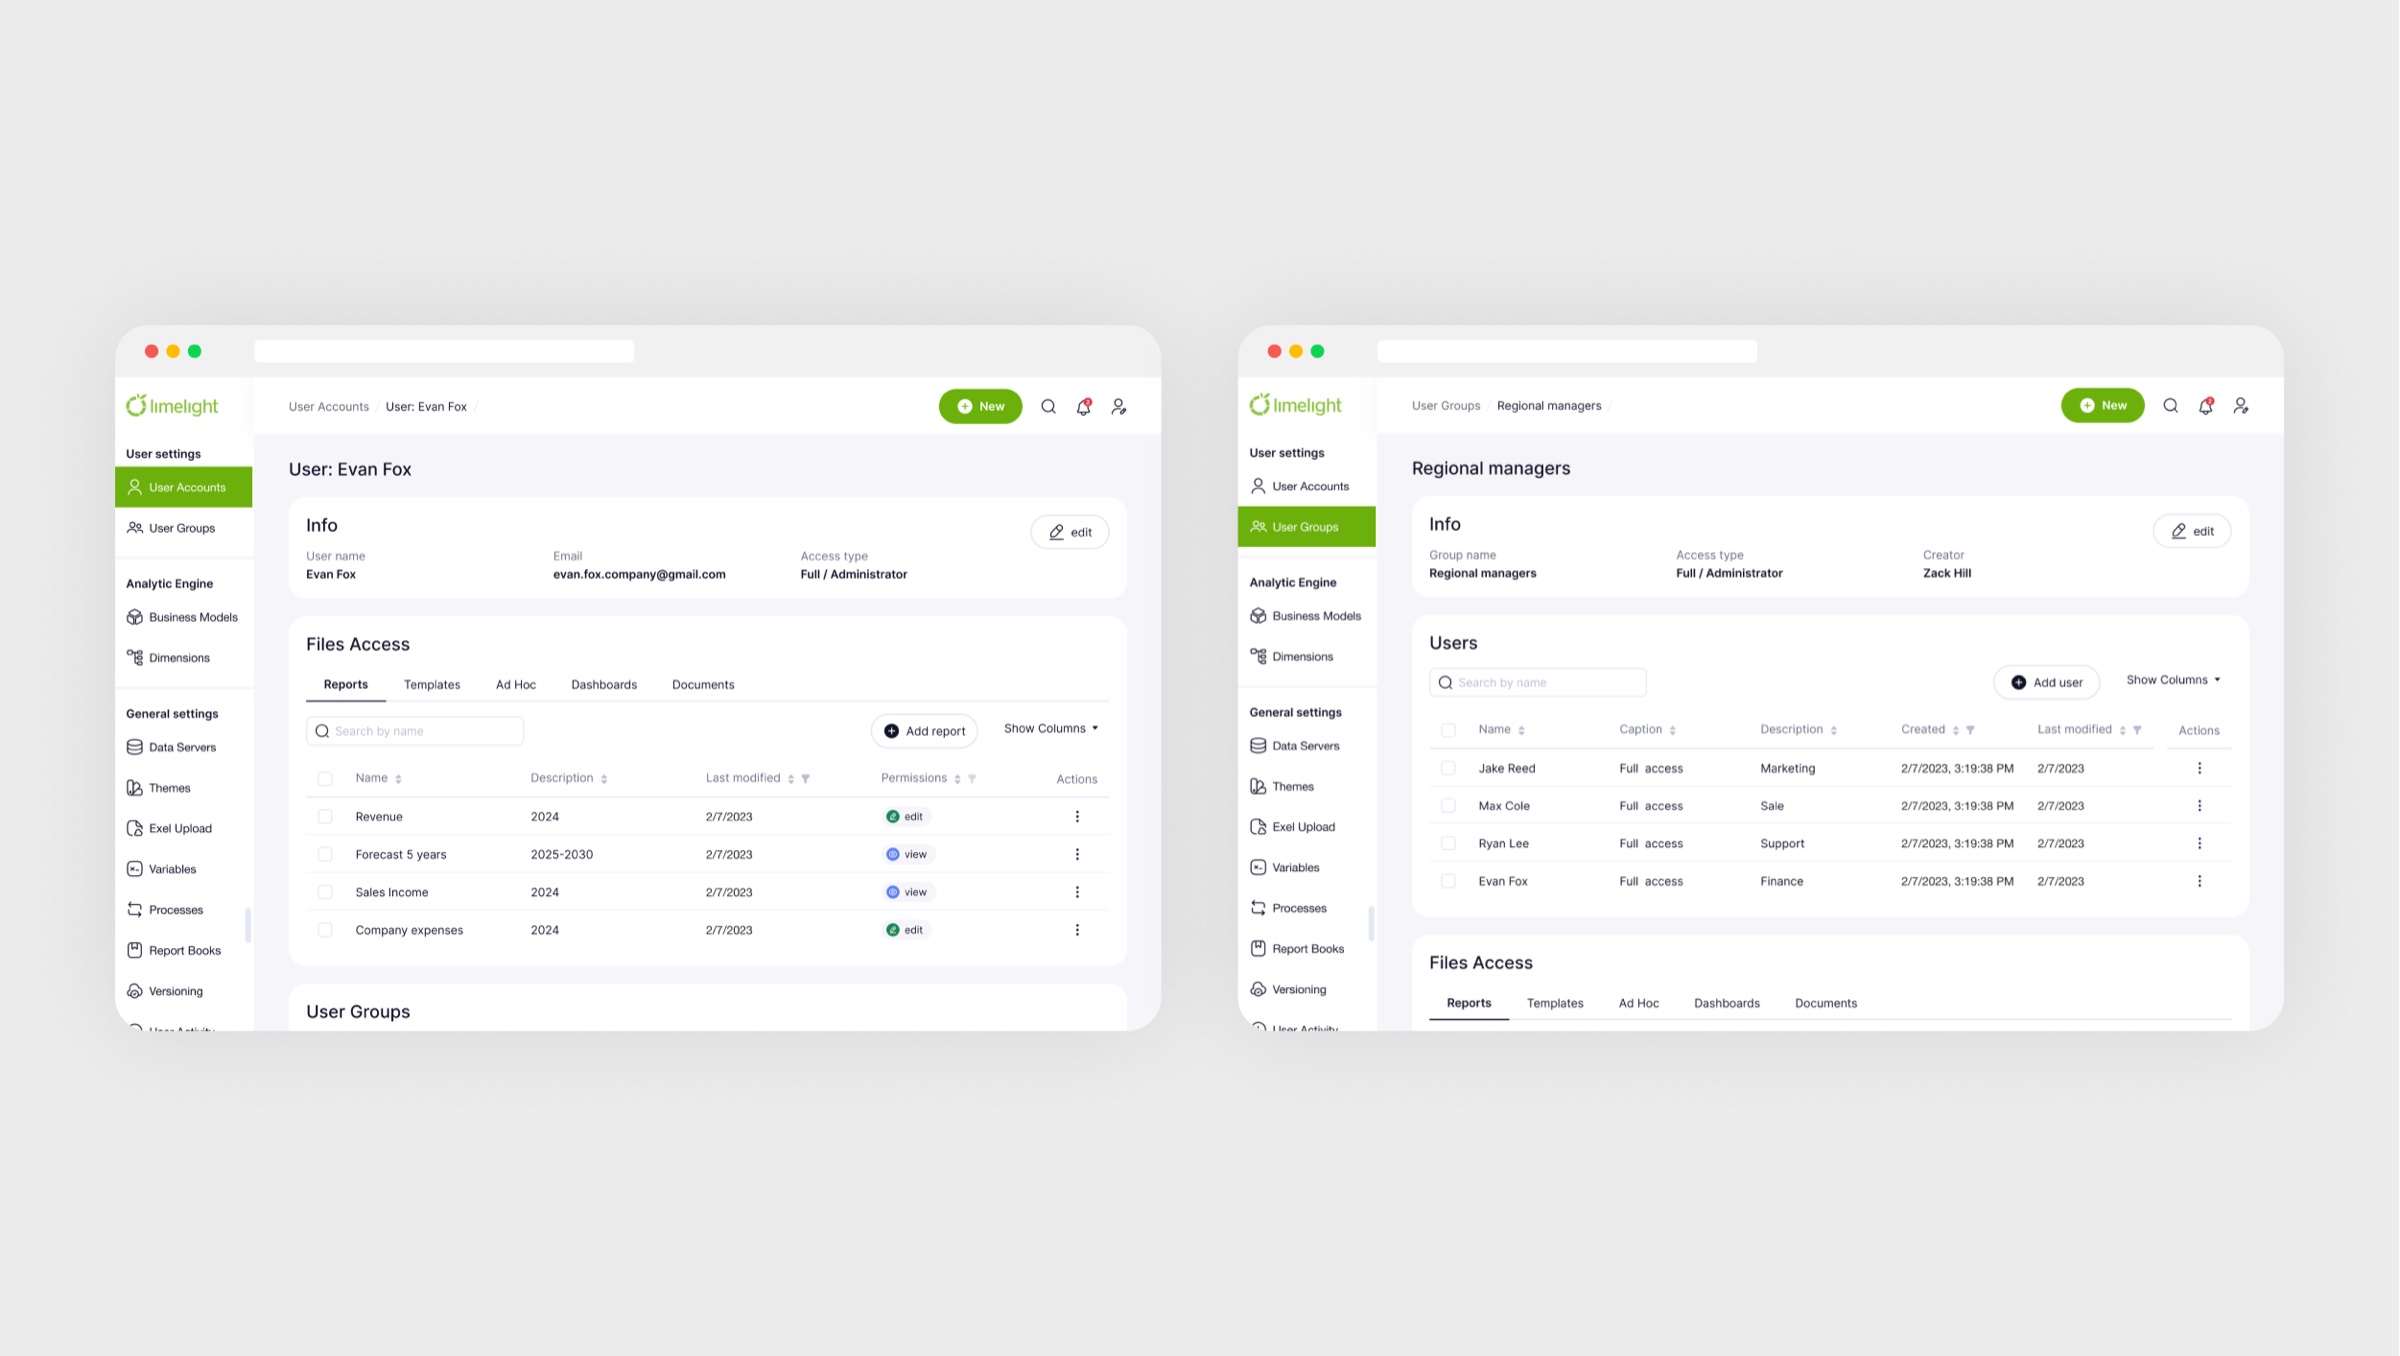
Access by group, not person by person, so it scales with the company.
09
Workflows & tasks
Problem
Budgeting season ran on email: who had submitted what, and what was blocking, lived in threads.
Hypothesis
If the process is modelled as ordered tasks with owners, the state of the season is visible without a single email.
Solution
Structured processes with ordered tasks assigned to people: budgeting season as a managed pipeline instead of email threads.
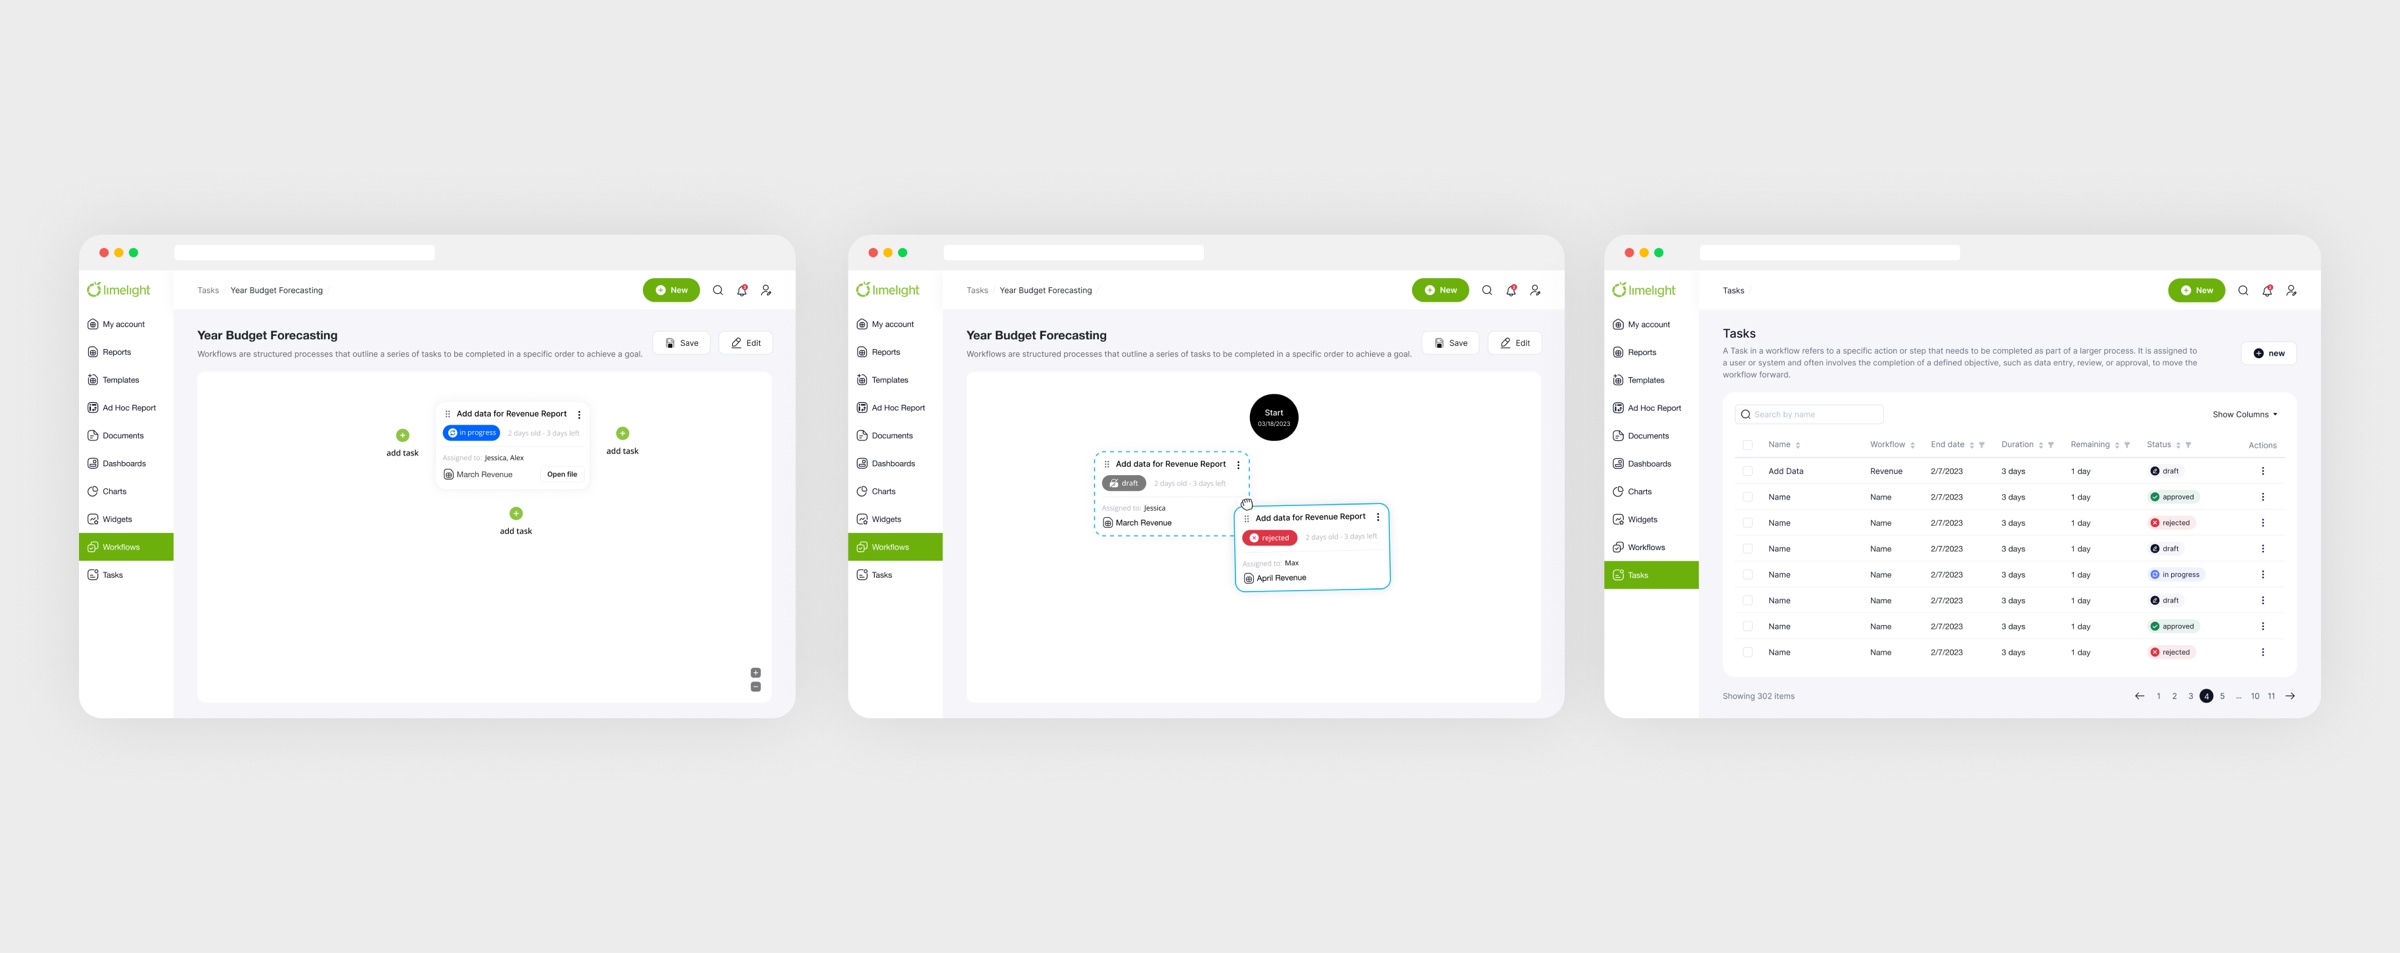
Budgeting season as a pipeline, not an email thread.
10
Sign in
Problem
Signing in gave no feedback: it was unclear whether an action registered, or what exactly was wrong.
Hypothesis
If states and validation are explicit, a person understands what went wrong on the first try.
Solution
Authentication reworked with clear states and validation feedback.
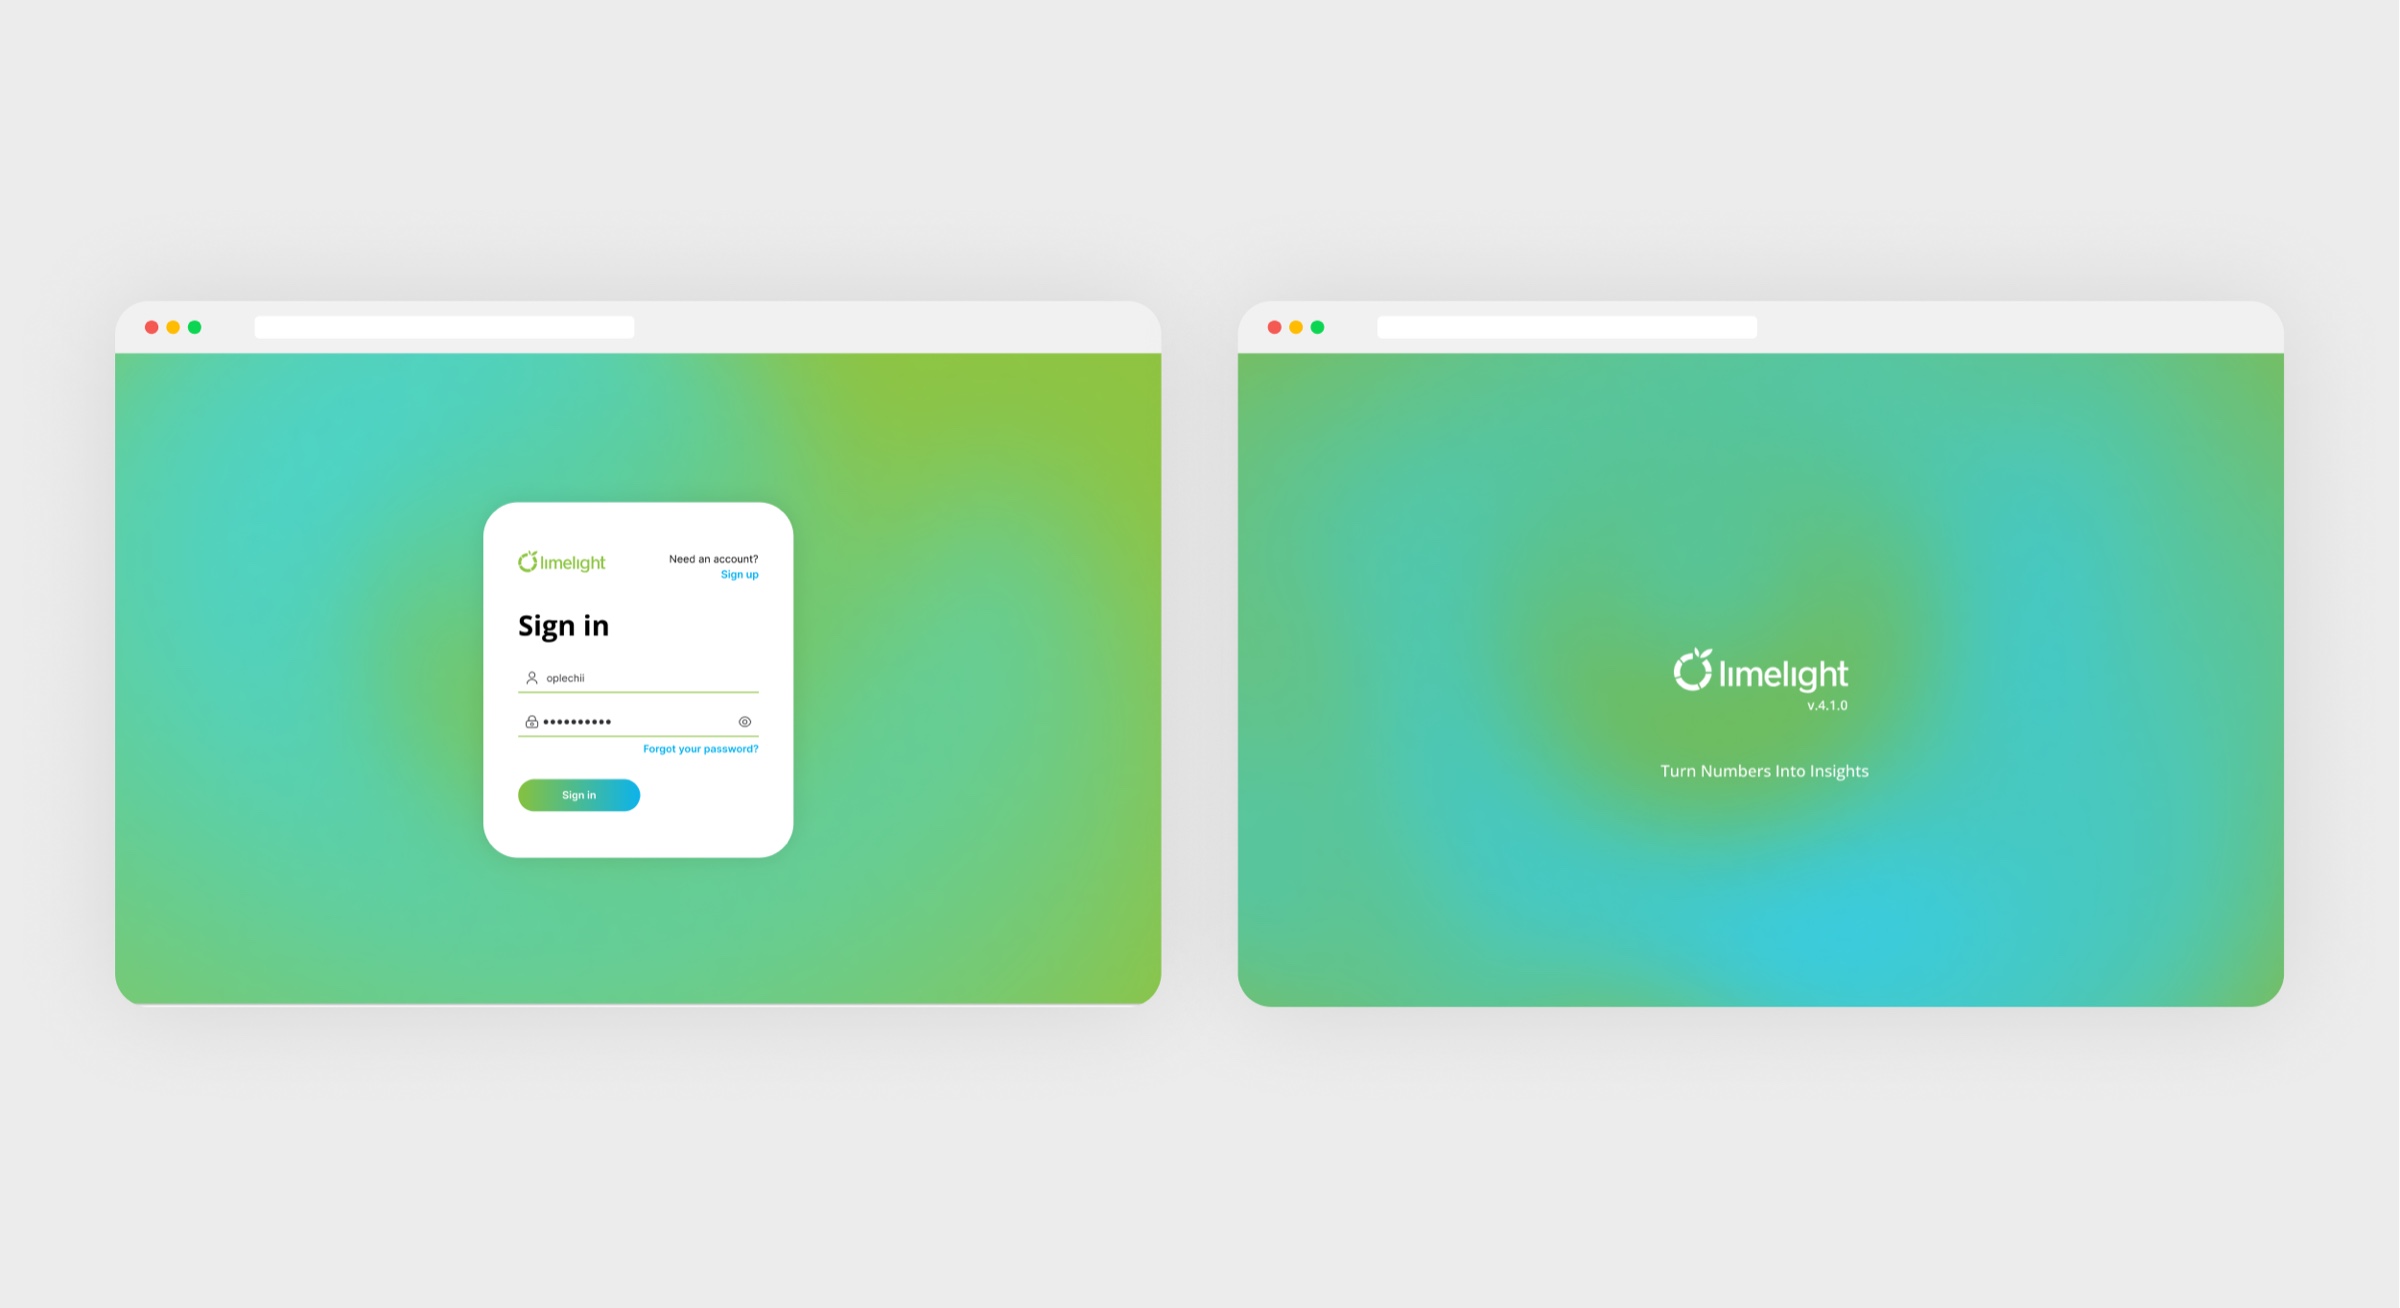
Every state designed, and errors say what to fix.
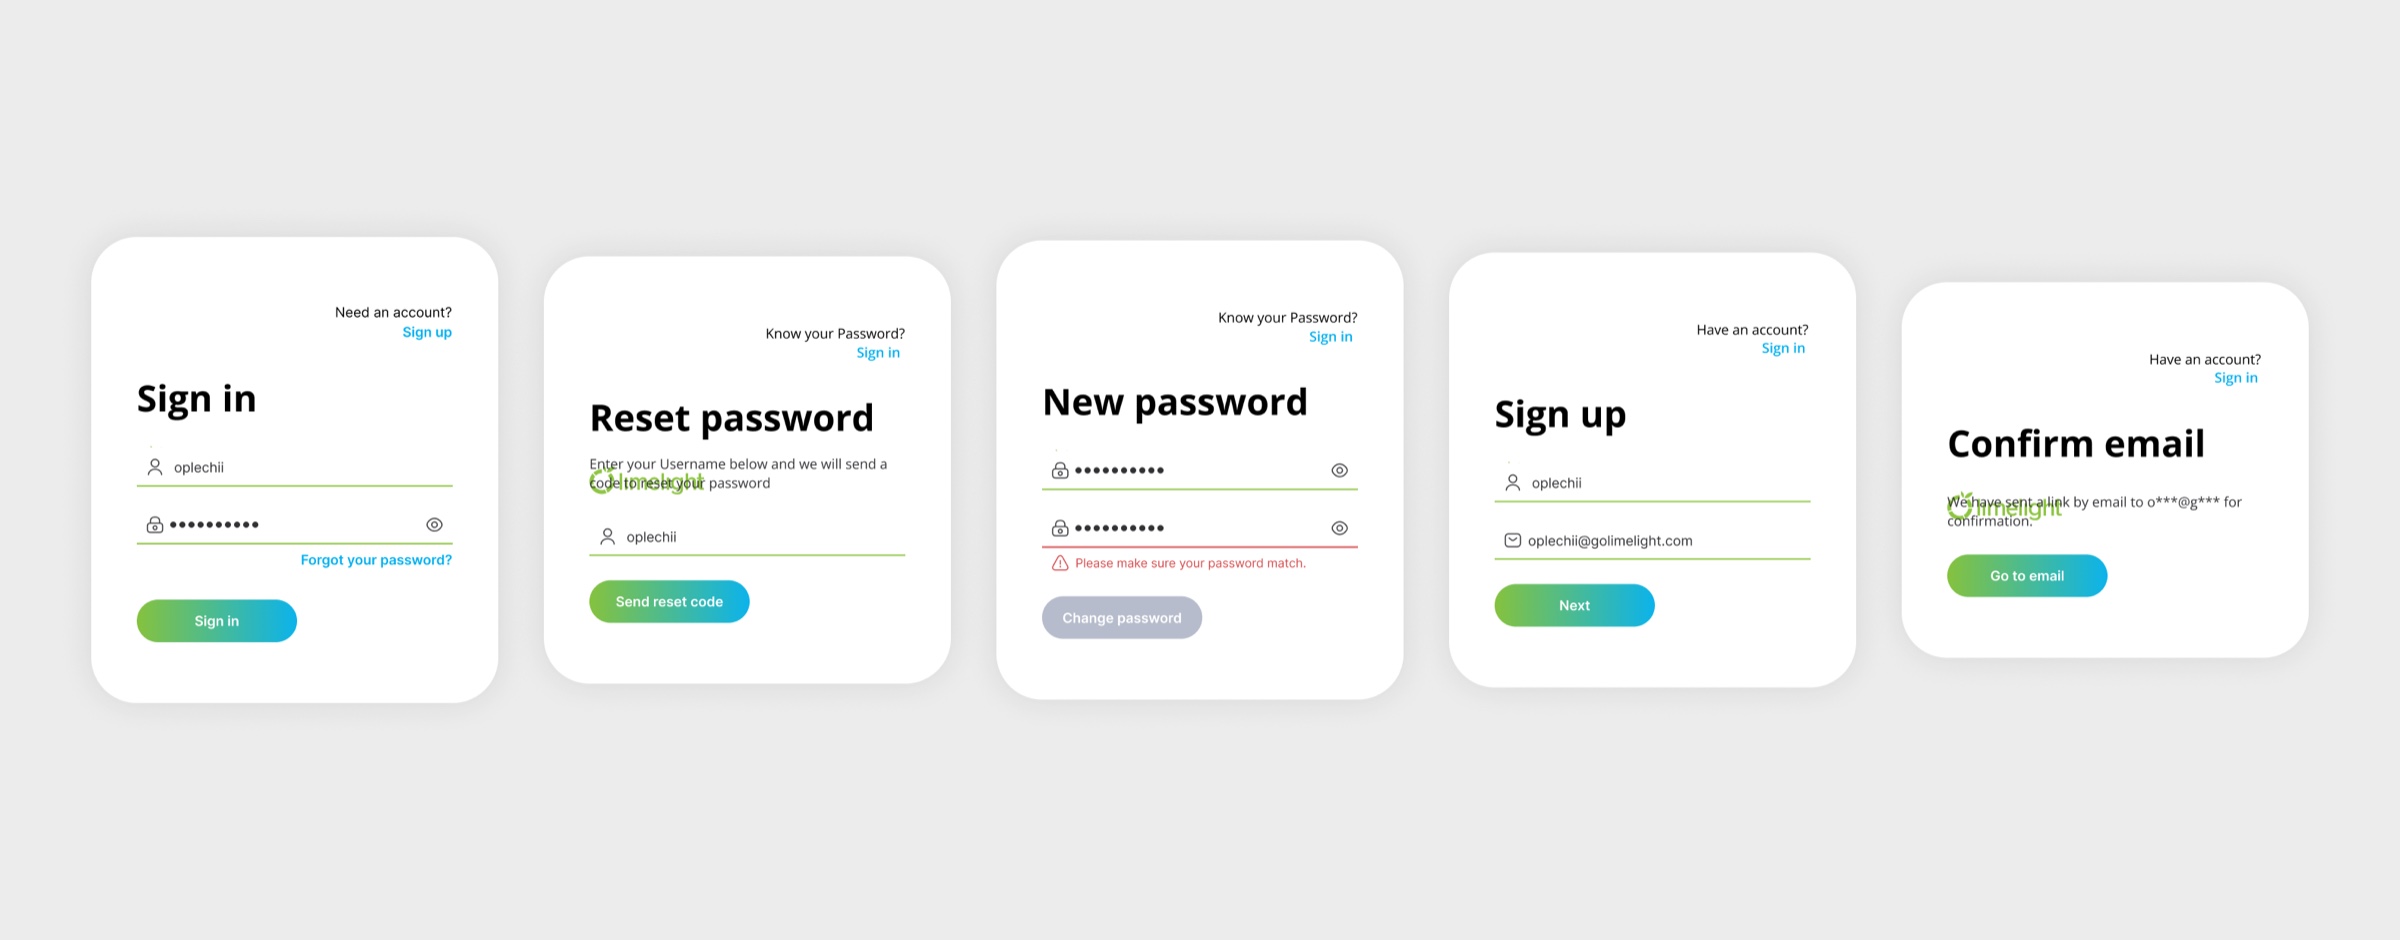
States and validation
11
Onboarding for non-financial users
Problem
People who are not finance professionals still have to enter figures and read reports, and they arrive for an outcome, not for a course in the product.
Hypothesis
If the product guides by scenario and explains in context, non-financial roles will manage without a separate training session.
Solution
Finance professionals are the primary users, but executives and department heads work in the system too. The onboarding was rebuilt around guided flows, in-context tooltips and scenario-based tutorials.
Note
The people who use it least often need the most guidance.
Result
They get into the product without a separate training session.
Key decisions
02
Meeting users in Excel, not against it
Problem
Accountants and managers live in Excel, so our different table interactions created usability friction instead of advantage.
Hypothesis
If table interactions mirror Excel habits, adoption follows, and the product's unique advantages become visible instead of hidden behind relearning.
Solution
Restructured table interactions to feel Excel-native and surfaced the product's advantages, such as linked data, roles and automation, on top of familiar mechanics.
Proof
Moderated sessions against the current version produced the prioritized feature list that went straight into development.
03
Ad Hoc reports over custom development
Problem
Every customer needed tailored report templates, and each one was built by the development team, which was slow and resource-intensive.
Hypothesis
If users can assemble templates themselves from variables, most custom-report requests disappear.
Solution
Designed the Ad Hoc Report builder: pick variables, get a tailored template, reuse it.
Proof
Tailored reporting without development in the loop: the feature cut custom-template work.
Outcome
- A design system from scratch: patterns, UX writing, icons, loaders, color hierarchy
- Navigation rebuilt into two sidebars from behavior analytics
- Excel-native tables and dashboards people build themselves
- Ad Hoc Reports cut custom development
A product with a foundation: consistent patterns, clear roles, and reporting that no longer waits for developers.
Next case
Inventory system for a mini-market chain
A scanner-first Android app running inventory, deliveries and daily tasks for a grocery mini-market chain. Sole designer from the business model to beta across the chain, tested with real store staff at every step.
View case